Page 194 - BA2 Integrated Workbook STUDENT 2018
P. 194

Chapter 11


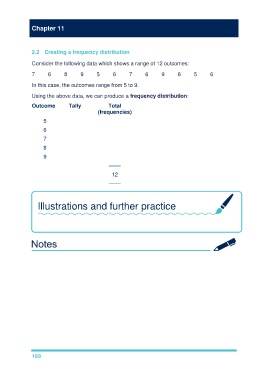
               2.2  Creating a frequency distribution

               Consider the following data which shows a range of 12 outcomes:

               7      6       8      9      5      6      7       6      9      6      5      6

               In this case, the outcomes range from 5 to 9.

               Using the above data, we can produce a frequency distribution:
               Outcome          Tally            Total
                                            (frequencies)

                    5             II               2
                    6            IIII              5

                    7             II               2
                    8             I                1
                    9             II               2

                                                 ––––

                                                   12
                                                 ––––


                  Illustrations and further practice


                  Now try TYU 1


               188
   189   190   191   192   193   194   195   196   197   198   199