
Page 223 - BA2 Integrated Workbook STUDENT 2018
P. 223
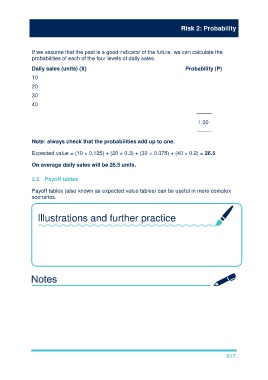
Risk 2: Probability


               If we assume that the past is a good indicator of the future, we can calculate the
               probabilities of each of the four levels of daily sales.

               Daily sales (units) (X)                                             Probability (P)

               10                             5 ÷ 40 =                                   0.125
               20                             12 ÷ 40 =                                  0.30

               30                             15 ÷ 40 =                                  0.375
               40                             8 ÷ 40 =                                   0.20
                                                                                        –––––

                                                                                         1.00

                                                                                        –––––
               Note: always check that the probabilities add up to one.


               Expected value = (10 × 0.125) + (20 × 0.3) + (30 × 0.375) + (40 × 0.2) = 26.5

               On average daily sales will be 26.5 units.


               2.2   Payoff tables

               Payoff tables (also known as expected value tables) can be useful in more complex
               scenarios.


                  Illustrations and further practice


                  Try TYU 5


                  Go over illustration 4

                  Try TYU 7


                                                                                                      217