
Page 279 - BA2 Integrated Workbook STUDENT 2018
P. 279
Supplementary objective test questions
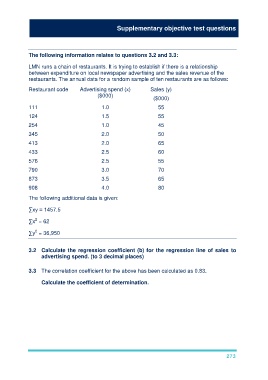
The following information relates to questions 3.2 and 3.3:
LMN runs a chain of restaurants. It is trying to establish if there is a relationship
between expenditure on local newspaper advertising and the sales revenue of the
restaurants. The annual data for a random sample of ten restaurants are as follows:
Restaurant code Advertising spend (x) Sales (y)
($000)
($000)
111 1.0 55
124 1.5 55
254 1.0 45
345 2.0 50
413 2.0 65
433 2.5 60
576 2.5 55
790 3.0 70
873 3.5 65
908 4.0 80
The following additional data is given:
∑xy = 1457.5
2
∑x = 62
2
∑y = 36,950
3.2 Calculate the regression coefficient (b) for the regression line of sales to
advertising spend. (to 3 decimal places)
3.3 The correlation coefficient for the above has been calculated as 0.83.
Calculate the coefficient of determination.
273