Page 289 - F2 - MA Integrated Workbook STUDENT 2018-19
P. 289

Statistical techniques


                           Test your understanding answers


                   Test your understanding 1


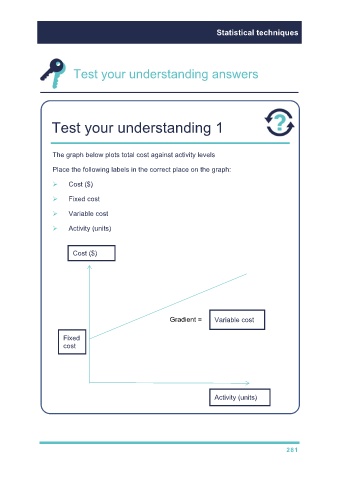
                   The graph below plots total cost against activity levels

                   Place the following labels in the correct place on the graph:


                        Cost ($)

                        Fixed cost

                        Variable cost

                        Activity (units)


                           Cost ($)


                                                             Gradient =     Variable cost


                       Fixed
                       cost


                                                                            Activity (units)


                                                                                                      281
   284   285   286   287   288   289   290   291   292   293   294