
Page 46 - F2 - MA Integrated Workbook STUDENT 2018-19
P. 46
Chapter 3
Bar charts
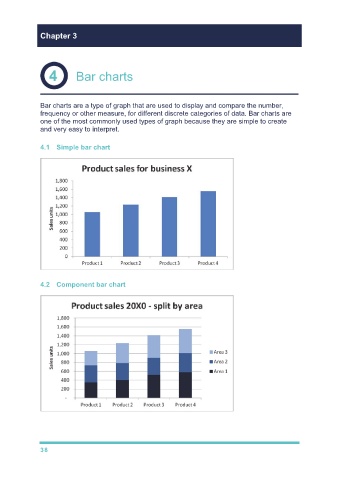
Bar charts are a type of graph that are used to display and compare the number,
frequency or other measure, for different discrete categories of data. Bar charts are
one of the most commonly used types of graph because they are simple to create
and very easy to interpret.
4.1 Simple bar chart
4.2 Component bar chart
38