
Page 59 - FINAL CFA SLIDES DECEMBER 2018 DAY 14
P. 59
LOS 52.g: Define and compare the spot curve, Session Unit 14:
yield curve on coupon bonds, par curve, and
forward curve., p.52 52. Introduction To Fixed Income Valuation
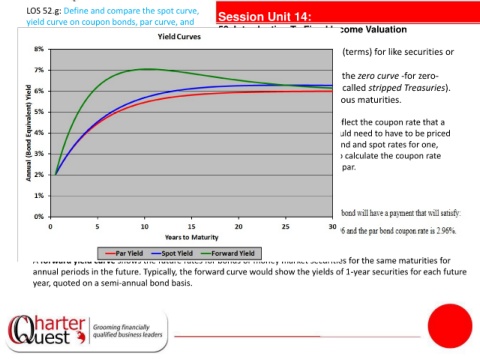
• Term structure of interest rates refers to the yields at different maturities (terms) for like securities or
interest rates (makes up the yield curve)
• The spot rate yield curve (spot curve) for U.S. Treasury bonds (also called the zero curve -for zero-
coupon) or strip curve (because zero-coupon U.S. Treasury bonds are also called stripped Treasuries).
• A yield curve for coupon bonds shows the YTMs for coupon bonds at various maturities.
• A par bond yield curve, or par curve, reflect the coupon rate that a
hypothetical bond at each maturity would need to have to be priced
at par. Consider a 3-year annual-pay bond and spot rates for one,
tanties 2 3
two, and three years of S , S , and S . To calculate the coupon rate
1
necessary for the bond to be trading at par.
A forward yield curve shows the future rates for bonds or money market securities for the same maturities for
annual periods in the future. Typically, the forward curve would show the yields of 1-year securities for each future
year, quoted on a semi-annual bond basis.