
Page 460 - F2 Integrated Workbook STUDENT 2019
P. 460
Chapter 19
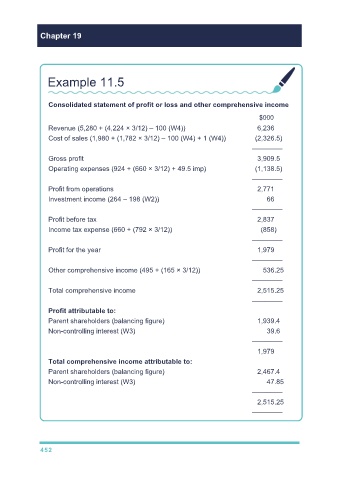
Example 11.5
Consolidated statement of profit or loss and other comprehensive income
$000
Revenue (5,280 + (4,224 × 3/12) – 100 (W4)) 6,236
Cost of sales (1,980 + (1,782 × 3/12) – 100 (W4) + 1 (W4)) (2,326.5)
––––––––
Gross profit 3,909.5
Operating expenses (924 + (660 × 3/12) + 49.5 imp) (1,138.5)
––––––––
Profit from operations 2,771
Investment income (264 – 198 (W2)) 66
––––––––
Profit before tax 2,837
Income tax expense (660 + (792 × 3/12)) (858)
––––––––
Profit for the year 1,979
––––––––
Other comprehensive income (495 + (165 × 3/12)) 536.25
––––––––
Total comprehensive income 2,515.25
––––––––
Profit attributable to:
Parent shareholders (balancing figure) 1,939.4
Non-controlling interest (W3) 39.6
––––––––
1,979
Total comprehensive income attributable to:
Parent shareholders (balancing figure) 2,467.4
Non-controlling interest (W3) 47.85
––––––––
2,515.25
––––––––
452