
Page 17 - FINAL CFA II SLIDES JUNE 2019 DAY 8
P. 17
LOS 31.j: Evaluate a stock by the method of comparables READING 31: MARKET-BASED VALUATION: PRICE AND
and explain the importance of fundamentals in using the ENTERPRISE VALUE MULTIPLES
method of comparables.
LOS 31.r: Evaluate whether a stock is overvalued, fairly MODULE 31.4: EV AND OTHER ASPECTS
valued, or undervalued based on comparisons of
multiples.
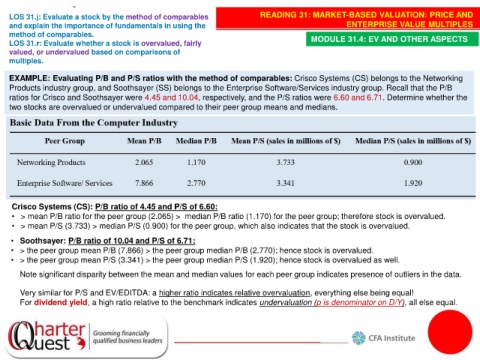
EXAMPLE: Evaluating P/B and P/S ratios with the method of comparables: Crisco Systems (CS) belongs to the Networking
Products industry group, and Soothsayer (SS) belongs to the Enterprise Software/Services industry group. Recall that the P/B
ratios for Crisco and Soothsayer were 4.45 and 10.04, respectively, and the P/S ratios were 6.60 and 6.71. Determine whether the
two stocks are overvalued or undervalued compared to their peer group means and medians.
Crisco Systems (CS): P/B ratio of 4.45 and P/S of 6.60:
• > mean P/B ratio for the peer group (2.065) > median P/B ratio (1.170) for the peer group; therefore stock is overvalued.
• > mean P/S (3.733) > median P/S (0.900) for the peer group, which also indicates that the stock is overvalued.
• Soothsayer: P/B ratio of 10.04 and P/S of 6.71:
• > the peer group mean P/B (7.866) > the peer group median P/B (2.770); hence stock is overvalued.
• > the peer group mean P/S (3.341) > the peer group median P/S (1.920); hence stock is overvalued as well.
Note significant disparity between the mean and median values for each peer group indicates presence of outliers in the data.
Very similar for P/S and EV/EDITDA: a higher ratio indicates relative overvaluation, everything else being equal!
For dividend yield, a high ratio relative to the benchmark indicates undervaluation (p is denominator on D/Y), all else equal.