
Page 90 - PM Integrated Workbook 2018-19
P. 90
Chapter 3
The multi-product profit volume graph
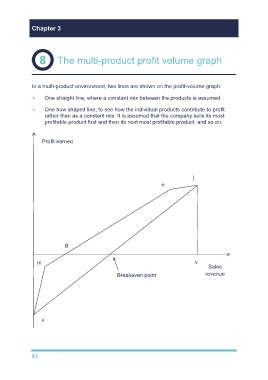
In a multi-product environment, two lines are shown on the profit-volume graph:
One straight line, where a constant mix between the products is assumed
One bow shaped line, to see how the individual products contribute to profit
rather than as a constant mix. It is assumed that the company sells its most
profitable product first and then its next most profitable product, and so on.
Profit earned
j
n
B
m v
Sales
Breakeven point revenue
k
82