Page 268 - P1 Integrated Workbook STUDENT 2018
P. 268

Chapter 12


               Chapter 11


                   Example 1


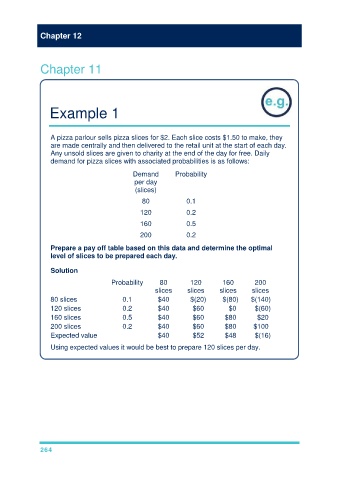
                   A pizza parlour sells pizza slices for $2. Each slice costs $1.50 to make, they
                   are made centrally and then delivered to the retail unit at the start of each day.
                   Any unsold slices are given to charity at the end of the day for free. Daily
                   demand for pizza slices with associated probabilities is as follows:

                                                Demand         Probability
                                                per day
                                                (slices)
                                                   80             0.1

                                                  120             0.2
                                                  160             0.5

                                                  200             0.2

                   Prepare a pay off table based on this data and determine the optimal
                   level of slices to be prepared each day.

                   Solution

                                        Probability      80         120        160        200
                                                       slices      slices     slices      slices
                   80 slices                0.1         $40         $(20)      $(80)     $(140)
                   120 slices               0.2         $40          $60         $0        $(60)
                   160 slices               0.5         $40          $60        $80        $20
                   200 slices               0.2         $40          $60        $80       $100
                   Expected value                       $40          $52        $48        $(16)
                   Using expected values it would be best to prepare 120 slices per day.


               264
   263   264   265   266   267   268   269   270   271   272   273