
Page 65 - P1 Integrated Workbook STUDENT 2018
P. 65
Break-even analysis
Example 2
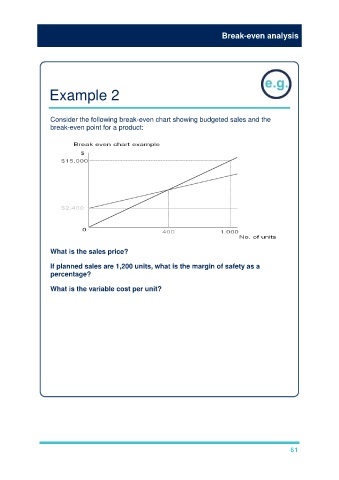
Consider the following break-even chart showing budgeted sales and the
break-even point for a product:
What is the sales price?
If planned sales are 1,200 units, what is the margin of safety as a
percentage?
What is the variable cost per unit?
Solution
Selling price
The highest line represents the revenue line. The gradient (or slope of this
line) is determined by revenue/units = price per unit. Taking the one known
point on this line (units = 1,000 and revenue = $15,000) we can calculate the
selling price per unit
=$15,000/1,000
= $15 per unit
61