
Page 173 - Microsoft Word - 00 Prelims.docx
P. 173
Risk and Uncertainty
5.2 Payoff tables
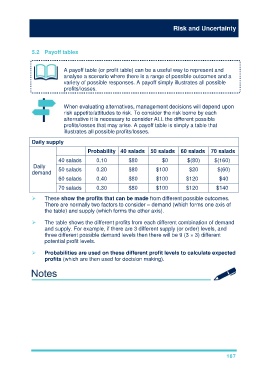
A payoff table (or profit table) can be a useful way to represent and
analyse a scenario where there is a range of possible outcomes and a
variety of possible responses. A payoff simply illustrates all possible
profits/losses.
When evaluating alternatives, management decisions will depend upon
risk appetite/attitudes to risk. To consider the risk borne by each
alternative it is necessary to consider ALL the different possible
profits/losses that may arise. A payoff table is simply a table that
illustrates all possible profits/losses.
Daily supply
Probability 40 salads 50 salads 60 salads 70 salads
40 salads 0.10 $80 $0 $(80) $(160)
Daily 50 salads 0.20 $80 $100 $20 $(60)
demand
60 salads 0.40 $80 $100 $120 $40
70 salads 0.30 $80 $100 $120 $140
These show the profits that can be made from different possible outcomes.
There are normally two factors to consider – demand (which forms one axis of
the table) and supply (which forms the other axis).
The table shows the different profits from each different combination of demand
and supply. For example, if there are 3 different supply (or order) levels, and
three different possible demand levels then there will be 9 (3 × 3) different
potential profit levels.
Probabilities are used on these different profit levels to calculate expected
profits (which are then used for decision making).
167