
Page 45 - FINAL CFA SLIDES JUNE 2019 DAY 2
P. 45
LOS 8.c: Calculate and interpret relative Session Unit 2:
frequencies (rf) and cumulative relative frequencies 8. Statistical Concepts and Market Returns
(crf), given a frequency distribution (fd, p134.
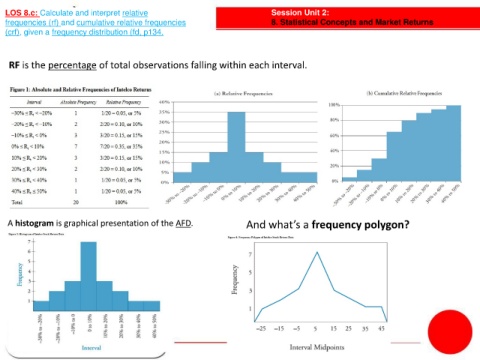
RF is the percentage of total observations falling within each interval.
A histogram is graphical presentation of the AFD. And what’s a frequency polygon?