
Page 15 - SCS May 2018 - Day 1 Suggested Solutions
P. 15
SUGGESTED SOLUTIONS
Chapter Six – F3
EXERCISE 1
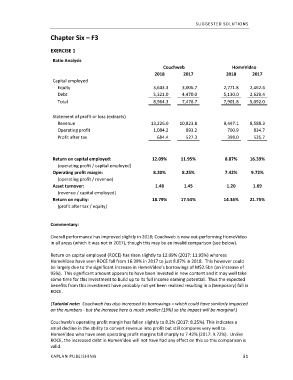
Ratio Analysis
Couchweb HomeVideo
2018 2017 2018 2017
Capital employed
Equity 3,643.3 3,006.7 2,771.8 2,462.6
Debt 5,321.0 4,470.0 5,130.0 2,629.4
Total 8,964.3 7,476.7 7,901.8 5,092.0
Statement of profit or loss (extracts)
Revenue 13,226.0 10,823.8 9,447.1 8,588.3
Operating profit 1,084.2 893.2 700.9 834.7
Profit after tax 684.4 527.3 398.0 535.7
Return on capital employed: 12.09% 11.95% 8.87% 16.39%
(operating profit / capital employed)
Operating profit margin: 8.20% 8.25% 7.42% 9.72%
(operating profit / revenue)
Asset turnover: 1.48 1.45 1.20 1.69
(revenue / capital employed)
Return on equity: 18.79% 17.54% 14.36% 21.75%
(profit after tax / equity)
Commentary:
Overall performance has improved slightly in 2018; Couchweb is now out-performing HomeVideo
in all areas (which it was not in 2017), though this may be an invalid comparison (see below).
Return on capital employed (ROCE) has risen slightly to 12.09% (2017: 11.95%) whereas
HomeVideo have seen ROCE fall from 16.39% in 2017 to just 8.87% in 2018. This however could
be largely due to the significant increase in HomeVideo’s borrowings of M$2.5bn (an increase of
95%). This significant amount appears to have been invested in new content and it may well take
some time for this investment to build up to its full income earning potential. Thus the expected
benefits from this investment have probably not yet been realised resulting in a (temporary) fall in
ROCE.
(Tutorial note: Couchweb has also increased its borrowings – which could have similarly impacted
on the numbers - but the increase here is much smaller (19%) so the impact will be marginal.)
Couchweb’s operating profit margin has fallen slightly to 8.2% (2017: 8.25%). This indicates a
small decline in the ability to convert revenue into profit but still compares very well to
HomeVideo who have seen operating profit margins fall sharply to 7.42% (2017: 9.72%). Unlike
ROCE, the increased debt in HomeVideo will not have had any effect on this so this comparison is
valid.
KAPLAN PUBLISHING 51