Page 149 - CombinedTest_Neat
P. 149

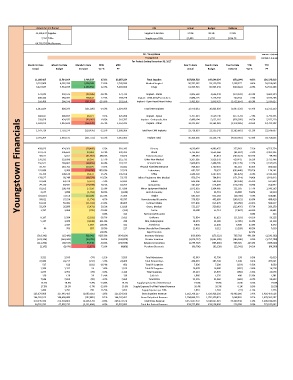
Actual Current Period                            KPI           Actual   Budget  Variance
                11,305,417 Supplies                          Supplies % Net Rev  17.5%  20.2%    2.74%
                  7,556 EIPAs                                 Supplies per EIPA  $1,496  $1,791  $294.78
                64,765,793 Net Revenue

                                                             61 - Youngstown                                  RUN DATE: 1/10/2018
                                                              Youngstown                                      RUN TIME: 8:18:46 AM
                                                        For Periods Ending December 31, 2017
             Month To Date  Month To Date  Month To Date  MTD  MTD            Year To Date  Year To Date  Year To Date  YTD  YTD
               Actual   Budget    Variance  Var %  PY                          Actual   Budget  Variance  Var %  PY
                              11,305,417                     13,714,014                       2,408,597  17.6%               12,657,224  Total Supplies              167,569,728              166,699,634                     (870,094)   -0.5%               156,375,919
                                3,353,900                       4,392,268                       1,038,369  23.6%                 3,745,595  Medical Surgical                50,791,582                53,130,159                  2,338,577   4.4%                 50,816,045
                                3,822,587                       4,961,045                       1,138,458  22.9%                 5,283,060  Drugs                61,424,923                60,904,241                     (520,682)   -0.9%                 52,532,268
                                     172,841                          132,535                            (40,306)   -30.4%                    173,721  Implant - Stents                  2,005,569                   1,626,441                      (379,128)   -23.3%                   1,602,244
                                     480,344                          580,787                            100,443   17.3%                    569,728  Implant - CRM AICD/Pacemakers                  6,984,175                   7,128,730                       144,554  2.0%                   7,075,288
                                     358,400                          166,976                          (191,424)  -114.6%                    281,550  Implant - Open Heart/Heart Valves                  3,481,087                   2,048,433                  (1,432,654)  -69.9%                   2,534,627
                                1,011,584                            880,299                         (131,286)  -14.9%                 1,024,999  Total CRM Implants                12,470,831                10,803,603                 (1,667,228)  -15.4%                 11,212,159
                                     260,617                          286,694                               26,077  9.1%                    325,898  Implant - Spinal                  3,797,324                   3,519,746                      (277,578)   -7.9%                   3,792,345
         Youngstown Financials
                                     550,020                          459,937                            (90,083)   -19.6%                    510,787  Implant - Orthopedic Joint                  6,480,194                   5,652,116                      (828,078)   -14.7%                   5,972,220
                                1,169,073                       1,012,643                         (156,430)  -15.4%                 1,152,221  Implant - Other                13,441,307                12,163,281                 (1,278,026)  -10.5%                 12,782,132
                                1,979,710                       1,759,274                         (220,436)  -12.5%                 1,988,906  Total Non-CRM Implants                23,718,824                21,335,142                 (2,383,682)  -11.2%                 22,546,697
                                2,991,294                       2,639,572                         (351,722)  -13.3%                 3,013,905  Implant Total                36,189,656                32,138,745                 (4,050,910)  -12.6%                 33,758,855
                                     458,026                          429,566                            (28,460)   -6.6%                    381,193  Dietary                  4,630,492                   4,986,455                       355,963  7.1%                   4,753,754
                                     197,572                          296,622                               99,051  33.4%                    299,292  Blood                  3,735,052                   3,653,168                        (81,884)  -2.2%                   3,902,235
                                       38,612                                6,651                           (31,961)   -480.5%                      18,826  Endomechanical                      289,381                        81,814                     (207,567)   -253.7%                         99,790
                                     270,931                          329,098                               58,166  17.7%                    315,733  Other Non-Medical                  3,207,936                   3,828,378                       620,441  16.2%                   3,731,466
                                     256,522                          188,067                            (68,455)   -36.4%                    210,111  IV and IV Sets                  2,600,974                   2,308,795                      (292,179)   -12.7%                   2,197,515
                                       39,707                          149,782                            110,075   73.5%                      41,842  Physical Plant/Maintenance                      968,019                  1,709,041                       741,022  43.4%                       496,628
                                     131,089                                6,383                         (124,706)  -1953.9%                      52,528  Laboratory                      681,797                        78,357                     (603,440)   -770.1%                       174,141
                                       91,709                          108,126                               16,417  15.2%                    135,558  Office                  1,348,520                   1,267,091                        (81,429)  -6.4%                   1,310,118
                                     128,627                              60,248                           (68,379)   -113.5%                      73,176  Minor Equipment Non-Medical                      876,524                      704,810                     (171,714)   -24.4%                   1,816,913
                                       47,504                              44,278                               (3,227)  -7.3%                      52,832  Suture                      625,396                      543,258                       (82,138)  -15.1%                       537,622
                                       79,130                              49,931                           (29,199)   -58.5%                      63,357  Instruments                      741,607                      613,469                     (128,138)   -20.9%                       654,952
                                       81,553                          108,708                               27,156  25.0%                    117,836  Minor Equipment Medical                  1,072,801                   1,304,065                       231,265  17.7%                   1,243,263
                                         3,657                                1,999                               (1,658)  -82.9%                       (1,049)  Linen & Laundry                          5,722                        22,701                        16,980  74.8%                         12,914
                                     (81,027)                               72,156                           153,184   212.3%                      75,499  Freight                      881,329                      852,563                       (28,766)  -3.4%                       920,881
                                       39,012                              37,254                               (1,758)  -4.7%                      45,797  Housekeeping & Laundry                      579,310                      432,689                     (146,621)   -33.9%                       498,420
                                       61,913                              50,000                           (11,913)   -23.8%                      46,855  Contrast Media                      677,836                      613,879                       (63,958)  -10.4%                       584,617
                                       32,359                              26,889                               (5,471)  -20.3%                      12,818  Gases, Medical                      552,137                      329,682                     (222,456)   -67.5%                       286,250
                                         1,797                                1,004                                  (793)  -79.0%                          (132)   Forms                        19,200                        11,713                         (7,487)  -63.9%                         15,651
                                            -                                     -                                     -    0.0%                             313  Fuel (aircraft & auto)                              -                                -                                -    0.0%                               313
                                         8,197                                5,264                               (2,932)  -55.7%                         5,423   Uniforms                        73,054                        61,851                       (11,203)  -18.1%                         59,335
                                         5,157                                1,009                               (4,148)  -411.0%                             299  Film, Radiographic                        14,474                        12,380                         (2,095)  -16.9%                         12,119
                                            -                                  1,047                                1,047  100.0%                             423  Anesthesia                          6,036                        12,845                          6,808  53.0%                            8,272
                                              46                                    703                                  657  93.5%                             227  Dietary Utensils Non-Disposable                        11,401                          8,112                         (3,289)  -40.5%                            7,630
                                            -                                     -                                     -    100.0%                              -  Dept Transfers                              -                                -                                -    42.9%                                -
                                  (518,342)                           (15,400)                            502,941   -3265.8%                   (994,824)  Inventory Variance                     (939,090)                      (173,322)                       765,768  -441.8%                  (1,220,362)
                                  (122,136)                        (161,841)                          (39,705)   24.5%                   (143,870)  Premier Incentive                 (1,676,757)                (1,861,305)                    (184,548)   9.9%                  (1,757,790)
                                  (111,784)                           (68,344)                               43,440  -63.6%                   (190,596)  Rebates & Incentives                 (1,749,787)                    (783,860)                       965,926  -123.2%                     (989,626)
                                        (2,193)                              (8,070)                              (5,877)  72.8%                       (4,806)  Purchase Discounts                       (69,796)                      (92,138)                      (22,342)  24.2%                       (88,269)
                                         3,521                                3,595                                    (74)  -2.1%                         3,559   Total Admissions                        42,949                        42,756                              193   0.5%                         41,619
                                       23,986                              24,217                                  (231)  -1.0%                      24,409  Total Patient Days                      284,993                      283,744                          1,249  0.4%                       285,641
                                            517                                  618                                 (101)  -16.4%                             601  Total IP Surgeries                          7,036                          7,290                             (254)  -3.5%                            6,850
                                         1,356                                1,332                                     24   1.8%                         1,515   Total OP Surgeries                        16,078                        16,680                             (602)  -3.6%                         16,228
                                         1,873                                1,951                                    (78)  -4.0%                         2,116   Total Surgeries                        23,114                        23,970                             (856)  -3.6%                         23,078
                                            158                                  130                                    28   21.4%                             139  Cath Lab                          1,866                          1,376                              490   35.6%                            1,381
                                         7,556                                7,655                                    (99)  -1.3%                         7,659   Total EIPAs                        92,276                        92,960                             (683)  -0.7%                         90,623
                  16.1%     18.8%     -2.8%  -14.8%  18.1%  Supply Expense % of Net Revenue  19.0%  19.0%  0.0%  0.3%  19.0%
                  17.5%     20.2%     -2.7%  -13.6%  19.5%  Supply Expense % of Net Patient Revenue  20.4%  20.3%  0.1%  0.5%  20.2%
                                         1,496                                1,791                                   295  16.5%                         1,653   Supply Expense per EIPA                          1,816                          1,793                               (23)  -1.3%                            1,726
                            125,879,868                   127,943,453                      (2,063,585)  -1.6%            125,124,926  Gross Inpatient Revenue           1,562,768,257           1,526,306,201                36,462,056  2.4%            1,426,453,526
                            144,265,523                   144,458,408                         (192,885)  -0.1%            144,147,452  Gross Outpatient Revenue           1,794,849,715           1,792,200,823                  2,648,891   0.1%            1,679,563,307
                            270,145,391                   272,401,861                      (2,256,470)  -0.8%            269,272,378  Total Gross Revenue           3,357,617,972           3,318,507,024                39,110,948  1.2%            3,106,016,833
                              64,765,793                     67,897,276                      (3,131,484)  -4.6%               65,057,683  Total Net Patient Revenue              819,777,896              819,558,838                      219,058  0.0%               773,187,892
   144   145   146   147   148   149   150   151