
Page 78 - CombinedTest_Neat
P. 78
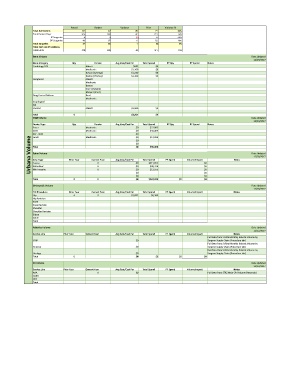
Actual    Budget    Variance   Prior   Variance %
               Total Admissions    102        82          20      71       24%
               Total Patient Days  325        283         42     221       15%
                       IP Surgeries  4         9          (5)     0        -56%
                       OP Surgeries  43       37          6       52       16%
               Total Surgeries      47        46          1       52        2%
               Total Cath Lab Procedures
               Total EIPAs         478        430         48     411       11%
               Stent Volume                                                                               Data Updated
                                                                                                           12/29/2017
               Stent Category  Qty      Vendor   Avg Cost/Cost Per  Total Spend  PY Qty  PY Spend  Notes
               Cardiology DES        Abbott              $685     $0
                                     Medtronic          $1,100    $0
                                     Boston (Synergy)   $1,250    $0
                                     Boston (Promus)    $1,100    $0
               Peripheral            Abbott
                                     Medtronic
                                     Boston
                                     Gore (Viabahn)
                                     Maquet (iCast)
               Drug Coated Balloon   Bard
                                     Medtronic
               Esophogeal
               Bili
               Carotid               Abbott             $1,900    $0
               Total            0                       $1,207    $0
               CRM Volume                                                                                 Data Updated
                                                                                                           12/29/2017
               Device Type     Qty      Vendor   Avg Cost/Cost Per  Total Spend  PY Qty  PY Spend  Notes
               Pacer                 Medtronic            $0    $27,983
               AICD                  Medtronic            $0    $56,405
               BIV - AICD            Medtronic            $0    $13,980
              Urbana Volume  Total  Prior Year  Current Year  Avg Cost/Cost Per  $0  Total Spend  PY Spend  Volume Impact  $0  Notes  Data Updated
                                                          $0
               Leads
                                                          $0
                                                          $0
                                                                $98,368
               Spine Volume
                                                                                                           12/28/2017
               Case Type
                                                          $0
                                                               $311,053
                                          0
               Fusion
               Stimulator
                                                          $0
                                          0
                                          0
                                                          $0
                                                                                      $0
               Min Invasive
                                                                $13,555
                                                          $0
                                                                                      $0
                                                          $0    $40,338               $0
                                                                                      $0
               Total            0         0               $0   $364,946     $0        $0
               Orthopedic Volume                                                                          Data Updated
                                                                                                           12/28/2017
               TJR Procedure  Prior Year  Current Year  Avg Cost/Cost Per  Total Spend  PY Spend  Volume Impact  Notes
               Hip              4         2             $3,091  $6,182
               Hip Revision
               Knee
               Knee Revision
               Shoulder
               Shoulder Revision
               Elbow
               Ankle
               Total
               Robotics Volume                                                                            Data Updated
                                                                                                           12/22/2017
               Service Line  Prior Year  Current Year  Avg Cost/Cost Per  Total Spend  PY Spend  Volume Impact  Notes
                                                                                        Pull Data from St Rita Monthly Robotic Volume by
               GYN                                        $0                            Surgeon Supply Chain (Procedure tab)
                                                                                        Pull Data from St Rita Monthly Robotic Volume by
               General                                    $0                            Surgeon Supply Chain (Procedure tab)
                                                                                        Pull Data from St Rita Monthly Robotic Volume by
               Urology                                    $0                            Surgeon Supply Chain (Procedure tab)
               Total            0                         $0      $0        $0        $0
               CV Volume                                                                                  Data Updated
                                                                                                           12/22/2017
               Service Line  Prior Year  Current Year  Avg Cost/Cost Per  Total Spend  PY Spend  Volume Impact  Notes
               AAA                        0               $0                            Pull Data from STRZ Main OR Volume (Heart tab)
               CABG
               CTO
               Total