
Page 150 - Mercy MOR All Regions_FinalwVideo
P. 150
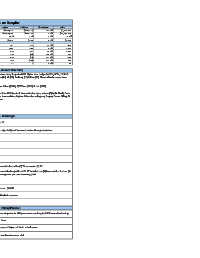
St. Anne Hospital
 Key Performance Indicators  Metric                                 503                                381                                1.7%  % Variance 32.0%                                498
              Variance
                                      Prior
 Actual
  Budget
                ($231,271)
                                       $1,946,909
 Supply Expense
   $1,803,119
 $2,034,390
                              -12.8%
                $296,716
                               2.8%
   $10,494,334
 $10,791,050
 Net Patient Revenue
                                      $10,317,122
       17.2%
 18.9%
                                          18.9%
 Supply Expense % Net Patient Revenue
                               9.9%
      $2,058
 $1,923
 Supply Expense per EIPA
                  $135
                               6.6%
                                         $1,872
                   122
 Total Admissions
 1,812

 Total Patient Days
                                          1,878
                               8.8%
      1,666
                   146
                                          1,040
                   182
       876
                              20.8%
 1,058
 Total EIPAs

 IP Surgeries
 84
       674
                              -11.1%
                   (75)
 OP Surgeries

                                           611
       788
                   (105)
                                           741
 Total Surgeries
                              -13.3%
 683

                               4.8%
                                           22
                     1

 22
 Outpatient Cath Lab Procedures                                   599                                114                                 (30)  -26.3%                                130
        21
 Site Performance Summary
 Overall supply expense unfavorable by $266.8K. Admissions , Patient days, Surgeries & ED  higher than budget by 32%, 8.7%, 11.3% &
 7.7% respectively.  Service lines with largest increase were Ortho (24), GI (22), Podiatry (21) & Pain (21). Those with decreases were
 Urology (12) & OB/GYN ( 10).
 Variance primarily driven by Spine ($189K), Ortho ($51K), Implant Other ($36K), IV/IV Sets ($20K) & Lab ($24K).
 Spine result of increase in fusion/mini invasive cases (14 ) by Drs Kristoff & Spetka & Neurostimulator procedures (3) by Dr Khalil; Ortho
 increased by five (5) cases with uptick in hips, shoulders and one knee revision; Implant Other due to Regency Surgery Center billing; IV
 & Lab expense impacted by increase in patient activity & flu cases.
 Overall flu related expense ($26.1K).
 St. Anne Hospital Leader's Summary
 Key Challenges
 Aquamantys usage - $13.5K
 Med/Surg   Maintain spend below budget in light of increased patient & surgery volumes
 Rx
 Continued growth in Neurostimulators five (5) TY versus two (2) PY.
 Ortho volume grew but case mix chnaged from PY. TY included one (1) knee revision & three (3)
 Implants
 shoulders  resulting in average cost per case increasing $306.
 Impact of flu related expense - $24.6K
 Other Expenses  Unbudgeted Other Non Medical expenses
 Actions Taken/Planned:
 Eliminated Nuvasive electrode probe for TLIF procedures resulting in $115K annualized savings.
 Convert 3 port to 2 port IV set
 Met with Surgery to understand impact of Navio robotic cases
 Met with Cath Lab to assess Resolute stent trial