
Page 162 - Mercy MOR All Regions_FinalwVideo
P. 162
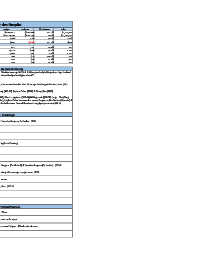
Key Performance Indicators  Metric                              4,441                          4,725                            ($100)  % Variance 30.0%  $11,376,020
 St. Charles Hospital
                                      Prior
              Variance
 Actual
  Budget
                              -21.6%
                ($297,980)
   $1,381,021
 $1,679,001
 Supply Expense
                                       $1,561,848
   $11,515,246
 $10,794,490
                              -6.3%
 Net Patient Revenue
                ($720,756)
 Supply Expense % Net Patient Revenue
 15.6%
                                          13.7%
                   3.6%
       12.0%
                                          $887
                              -11.6%
       $862
 $962
 Supply Expense per EIPA
       822
                              16.7%
 959

                   137

                                           956
 Total Admissions
                              -6.0%

 Total Patient Days
                                          4,999
                   (284)
 Total EIPAs
                   143
      1,603

                                          1,760
                               8.9%
 1,746
       104

 77

 IP Surgeries

       493
                              -5.1%

 468

 OP Surgeries
                   (25)


 Total Surgeries
       598
                   (53)

                              -8.9%
 545
 Site Performance Summary  (27)  -26.0%                              119  416  535
 Supply expense unfavorable to budget by $297K. Admissions & ED visits were up 16.7% & 1.3% respectively while patient days declined
 6%. IP Surgery volume increased both to budget & PY while OP missed budget but higher than PY.
 Surgery volume increased from 633 TY versus 581 PY.
 Service lines with largest increase were GI (69) & OB/GYN (6). Other service lines flat with PY except Gen Surg which was down (17 ).
 Supply expense variance primarly driven by Rx ($147K), Med/Surg ($33.4K), Impant Other ($24K) & IV supplies ($26K).
 Pharmacy experienced increases in Hormone & Synthetic ($39.8K), Blood coagulant  ($26.4K) & Diagnostic ($18.5K) drugs.  Med/Surg
 expense in support of new Vascular Surgeon, Dr Hacker (Vascular), Implant Other increase due to new Surgeons; Drs Hacker (Vascular) &
 Dr Momoh (Ortho) while IV supply expense driven largely by spike in flu cases. Overall flu related  supply expense was $37.1K.
 St. Charles Hospital Leader's Summary
 Key Challenges
 Increased spend for new Vascular Surgeon, Dr Hacker - $20K
 Med/Surg
 Higher RX expense coming from Oncology
 Rx
 Impact from new Ortho Surgeon (Dr Momoh) & Vascular Surgeon (Dr Hacker) - $22.4K
 Implants  Ortho volume declined along with average cost per case - $226
 Impact of Navio robotic cases
 Impact of flu related supplies - $37.1K
 Other Expenses
 Actions Taken/Planned:
 Convert 3 port to 2 port IV set
 Met with Pharmacy Director on Rx spend
 Met with Surgery to understand impact of Navio robotic cases