
Page 242 - Mercy MOR All Regions_FinalwVideo
P. 242
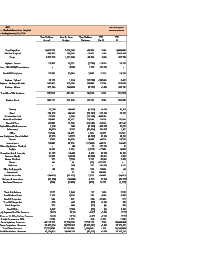
RUN DATE: 2/7/2018  RUN TIME: 3:31:02 PM  YTD  PY  3,059,032                       1,016,499                      918,742                         19,159                            -                                  19,159                            3,485                              325,968                         392,921                         722,374                         741,532                         73,768                            98,392                            -                                  92,991                            62,140                            16,638


                                1.6%  1.9%  5.8%  -13.9%  100.0%  11.2%  -538.0%  22.5%  -0.4%  9.5%  9.5%  -4.6%  -103.0%  -884.5%  29.5%  -39.3%  -417.8%  -284.2%  10.8%  -18.1%  44.7%  -68.1%  100.0%  -17.6%  17.2%  -42.0%  90.0%  -303.9%  100.0%  74.6%  100.0%  -24.8%  -13.2%  64.6%  1.6%  4.0%  -32.8%  -9.5%  (0)  (0)  -0.6%  -1.2%  -2.0%  7.3%  -3.4%  1.8%  -0.4%
                        YTD  Var %


                        Year To Date  Variance  49,787                          17,973                          64,934                          (2,758)                           5,593                            2,835                            (10,277)                        69,863                          (1,291)                           58,295                          61,130                          (3,836)                           (61,971)                        (19,137)                        23,249                          (23,165)                        (1,540)                           (15,144)


                        Year To Date  Budget  3,067,505                    969,342                        1,121,203                   19,831                          5,593                            25,424                          1,910                            309,878                        304,033                        615,821                        641,245                        83,841                          60,181                          2,164                            78,937                          58,888                          368                                5,329                            17,483


                        Year To Date  Actual  3,017,719                    951,370                        1,056,269                   22,589                          -                                22,589                          12,188                          240,015                        305,324                        557,526                        580,115                        87,676                          122,152                        21,301                          55,688                          82,053                          1,908                            20,473                          15,590


                    Mercy Health – St. Elizabeth Boardman Hospital         Total Supplies  Medical Surgical  Drugs  Implant - Stents Implant - CRM AICD/Pacemakers  Total CRM Implants  Implant - Spinal Implant - Orthopedic Joint  Implant - Other  Total Non-CRM Implants  Implant Total  Dietary  Blood  Endomechanical  Other Non-Medical  IV and IV Sets Physical Plant/Maintenance  Laboratory  Office Minor Equipment Non-Medical  Suture  Instruments Minor Equipment Medical  Freight  Housekeeping & Laundry  Contrast Media  Gases, Medical  Forms  Uniforms  Film, Radiographic  Anesthesia  Premier Incentive  Rebates & Incentives  Purch


                  6135  For Periods Ending January 31, 2018


                        MTD  PY  3,059,032  1,016,499  918,742  19,159  -                                  19,159  3,485  325,968  392,921  722,374  741,532  73,768  98,392  -                                  92,991  62,140  16,638  1,111  15,531  12,547  13,738  24,447  75                                   8,985  11,223  8,089  3,872  -                                  2,256  48                                   -                                  (34,421)  (27,837)  (1,335)  1,298  5,449  171                                 370                                 541                                 2,429  17.5%  17.8%  1,260  3


                                1.6%  1.9%  5.8%  -13.9%  100.0%  11.2%  -538.0%  22.5%  -0.4%  9.5%  9.5%  -4.6%  -103.0%  -884.5%  29.5%  -39.3%  -417.8%  -284.2%  10.8%  -18.1%  44.7%  -68.1%  100.0%  -17.6%  17.2%  -42.0%  90.0%  -303.9%  100.0%  74.6%  100.0%  -24.8%  -13.2%  64.6%  1.6%  4.0%  -32.8%  -9.5%  -15.7%  -3.6%  -0.6%  -1.2%  -2.0%  7.3%  -3.4%  1.8%  -0.4%
                        MTD  Var %


                        Month To Date  Variance  49,787                           17,973                           64,934                           (2,758)                            5,593                             2,835                             (10,277)                          69,863                           (1,291)                            58,295                           61,130                           (3,836)                            (61,971)                          (19,137)                          23,249                           (23,165)                          (1,540)                            (15,144)


                        Month To Date  Budget  3,067,505                     969,342                         1,121,203                    19,831                           5,593                             25,424                           1,910                             309,878                         304,033                         615,821                         641,245                         83,841                           60,181                           2,164                             78,937                           58,888                           368                                 5,329


                        Month To Date  Actual  3,017,719                         951,370                             1,056,269                         22,589                               -                                      22,589                               12,188                               240,015                             305,324                             557,526                             580,115                             87,676                               122,152                             21,301                               55,688                               82,053                               1,9