
Page 254 - Mercy MOR All Regions_FinalwithVideo
P. 254
RUN DATE: 2/7/2018 RUN TIME: 3:31:02 PM YTD PY 3,281,756 767,456 1,679,427 21,837 27,906 49,743 88,601 206,292 246,180 541,073 590,817 54,945 61,443 3,289 50,051 44,555 18,482 7,349
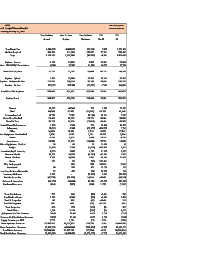
5.2% 20.7% -1.9% 68.8% 64.1% 66.1% 92.1% 31.0% -7.4% 23.3% 26.0% 1.4% -32.6% -94.1% 51.8% -40.4% 13.2% -726.9% 16.8% 16.3% 23.9% -76.7% 51.4% -116.1% 11.8% -20.5% 27.9% -200.6% 100.0% 81.6% 92.4% 0.0% -45.4% -38.3% 11.5% -5.4% -2.8% -40.4% -13.0% (0) (0) 2.0% 2.0% -1.2% 0.9% -0.7% -0.1% -7.0%
YTD Var %
Year To Date Variance 185,868 167,960 (38,368) 9,085 11,780 20,865 68,023 55,144 (15,601) 107,566 128,431 709 (19,742) (7,137) 25,172 (17,014) 264 (62,255) 2,919
Year To Date Budget 3,606,823 811,620 2,062,888 13,203 18,380 31,583 73,869 178,054 209,552 461,475 493,058 49,544 60,643 7,582 48,583 42,159 1,999 8,564 17,418 9,249
Year To Date Actual 3,420,955 643,660 2,101,256 4,117 6,600 10,717 5,846 122,910 225,152 353,909 364,626 48,835 80,385 14,719 23,411 59,174 1,735 70,819 14,499 7,73
Mercy Health – St. Joseph Warren Hospital For Periods Ending January 31, 2018 Total Supplies Medical Surgical Drugs Implant - Stents Implant - CRM AICD/Pacemakers Total CRM Implants Implant - Spinal Implant - Orthopedic Joint Implant - Other Total Non-CRM Implants Implant Total Dietary Blood Endomechanical Other Non-Medical IV and IV Sets Physical Plant/Maintenance Laboratory Office Minor Equipment Non-Medical Suture Instruments Minor Equipment Medical Freight Housekeeping & Laundry Contrast Media Gases, Medical Forms Film, Radiographic Anesthesia Dietary Utensils Non-Disp
6140
3,281,756 767,456 1,679,427 21,837 27,906 49,743 88,601 206,292 246,180 541,073 590,817 54,945 61,443 3,289 50,051 44,555 18,482 7,349 17,241 9,794 8,761 13,852 28 6,161 8,379 8,340 20,424 - 2,241 950 568 (22,676) (45,195) (23,823) (1,101) 786 3,441 126 424 550 2,059 22.5% 23.0% 1,594 26,449,957 42,849,666 69,299,624 14,263,273
MTD PY
5.2% 20.7% -1.9% 68.8% 64.1% 66.1% 92.1% 31.0% -7.4% 23.3% 26.0% 1.4% -32.6% -94.1% 51.8% -40.4% 13.2% -726.9% 16.8% 16.3% 23.9% -76.7% 51.4% -116.1% 11.8% -20.5% 27.9% -200.6% 100.0% 81.6% 92.4% 0.0% -45.4% -38.3% 11.5% -5.4% -2.8% -40.4% -13.0% -18.5% -6.3% 2.0% 2.0% -1.2% 0.9% -0.7% -0.1% -7.0%
MTD Var %
Month To Date Variance 185,868 167,960 (38,368) 9,085 11,780 20,865 68,023 55,144 (15,601) 107,566 128,431 709 (19,742) (7,137) 25,172 (17,014) 264 (62,255)
Month To Date Budget 3,606,823 811,620 2,062,888 13,203 18,380 31,583 73,869 178,054 209,552 461,475 493,058 49,544 60,643 7,582 48,583 42,159 1,999 8,564 17,418
Month To Date Actual 3,420,955 643,660 2,101,256 4,117 6,600 10,717 5,846 122,910 225,152 353,909 364,626 48,835 80,385 14,719 23,411 59,174 1,735