Page 197 - Mercy MOR All Regions_Final
P. 197

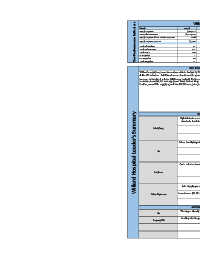
Key Performance Indicators  Metric                                  Willard Hospital  Variance ($120)  % Variance 19.3%  Prior  11.9%
                                                                                                                 Actual
                                                                                                                             Budget
                                                                                                                                                                  $268,790
                                                                                                                   $309,453
                                                                                                                               $249,424
                                                                                                                                           ($60,029)
                                                                                                                                                        -24.1%
                                                                                      Supply Expense
                                                                                                                                                         4.0%
                                                                                                                                                                 $2,267,533
                                                                                                                  $2,376,993
                                                                                                                                           $91,952
                                                                                      Net Patient Revenue
                                                                                                                              $2,285,041
                                                                                                                     13.0%
                                                                                                                                             2.1%
                                                                                      Supply Expense % Net Patient Revenue
                                                                                                                                 10.9%
                                                                                                                     $1,068
                                                                                                                                                        -12.7%
                                                                                                                                 $948
                                                                                                                                                                    $980
                                                                                      Supply Expense per EIPA
                                                                                      Total Admissions
                                                                                                                                                                      58
                                                                                                                                   49
                                                                                                                                                        24.5%
                                                                                                                       61
                                                                                                                                              12
                                                                                                                      237

                                                                                                                                  184

                                                                                                                                                        28.8%

                                                                                      Total Patient Days
                                                                                                                                                                     214
                                                                                                                                              53

                                                                                                                                                        10.3%
                                                                                                                                                                     274
                                                                                      Total EIPAs

                                                                                                                      290
                                                                                                                                              27
                                                                                                                                  263


                                                                                                                                                                      8
                                                                                                                                   5
                                                                                                                                               2
                                                                                                                                                        40.0%
                                                                                      IP Surgeries
                                                                                                                        7


                                                                                      OP Surgeries

                                                                                                                                   80
                                                                                                                       68
                                                                                                                                                        -11.8%
                                                                                                                                   85
                                                                                                                                              (10)
                                                                                      Total Surgeries
                                                                                                                       75
                                                                                                                                                                      71

                                                                                                                    Site Performance Summary  (12)      -15.0%                                 63
                                                                                      Willard's supply expense was unfavorable to budget by 24.1% ($60K), mostly driven by excess drug spend ($53.6K) on high-
                                                                                      dollar IV infusions. Additional areas of unfavorable spend included Implant - Ortho, Implant - Other, both driven by an
                                                                                      increase in Inpatient volume (40% over budget). Unfavorable spend is also found in Med/Surg, and Lab, driven by increases
                                                                                      in Admissions (24.5% to budget) and Total Patient Days (28.8% to budget) correspondingly contributed to these areas.
                                                                                      Further, overall flu supply spend was $5.3K over prior year, specifically notable in Lab & IV/IV Sets subaccounts.
                                                                                    Willard Hospital Leader's Summary
                                                                                                                         Key Challenges
                                                                                                               High Admissions and Patient Days compared to both PY and Budget with influx of flu patients.
                                                                                                               Also had a few infrequent Med/Surg supply purchases of $1K+/EA  from the OR. Spend was
                                                                                                                            unfavorable to budget by 15% for these reasons.
                                                                                              Med/Surg
                                                                                                              Driven heavily by patient treatments requiring high-dollar drugs such as Keytruda and Krystexxa
                                                                                                                               contributed $50K toward drug spend.
                                                                                                 Rx
                                                                                                              Ortho volumes increased over prior year, putting subaccount over by $5.5K; however, cost per
                                                                                                                             case decreased an average of over $.8K/case.
                                                                                               Implants
                                                                                                                Lab:  Supply spend unfavorable to budget by 24%, driven in-part by flu supplies as well as
                                                                                                                                     expanded testing.
                                                                                                              Instruments:  ($4.9K over budget); Additional instruments needed to support increased inpatient
                                                                                             Other Expenses
                                                                                                                                        volumes.
                                                                                                                     Actions Taken/Planned:
                                                                                                               Working to identify and review Pharmacy initiatives for 2018 that could be favorable to Drug
                                                                                                 Rx
                                                                                                                                      supply spend.
                                                                                                               Working with Surgery/OR Leadership on Instrument and Minor Equipment spend to identify
                                                                                              Surgery/OR
                                                                                                                                    areas of need in '18.
   192   193   194   195   196   197   198   199   200   201   202