
Page 37 - US Market Performance Report 1Q 2018
P. 37
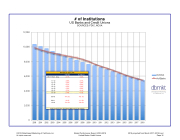
12,000
10,000
8,000
6,000
4,000
2,000
0
# of CU's # of Banks
# of Institutions
US Banks and Credit Unions SOURCES: FDIC, NCUA
08-'11 Ann. Avg.
11-'12 12-'13 13-'14 14-'15 15-'16 16-'17
RATES OF DECLINE
# of CU's # of Banks
-3.1%
-3.9% -3.9% -4.3% -4.0% -3.9% -3.7%
17-'18 -3.6% -4.1%
00-18
08-11 12-18
-47.5%
-9.1% -21.2%
-3.4%
-3.7% -3.8% -4.4% -5.0% -4.4% -4.1%
-45.1%
-11.4% -23.2%
2018 projected from annualized March 2017-2018 trend
2000 2001 2002 2003 2004 2005 2006 2007 2008 2009 2010 2011 2012 2013 2014 2015 2016 2017 2018
©2018 Data Based Marketing of California, Inc. Market Performance Report: 2000-2018 2018 projected from March 2017-2018 trend All rights reserved. United States Credit Unions Page 35
