
Page 55 - European Cruise Traveller Duty & Tax Free Retail
P. 55
Industry Insider:
European Cruise Duty & Tax Free Retail 2016
5.2.2.1 STEADY PERFORMERS: SHOPPING ENVIRONMENT
The shopping environment plays a fairly significant role in shaping shopper behaviour and driving a shopper’s propensity to purchase. This is particularly the case in higher value categories, such as Watches & Jewellery and Fashion & Accessories.
SHOPPING ENVIRONMENT PRIORITY RATING: 2
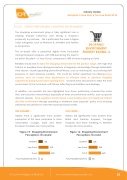
The on-board offer is perceived slightly more favourably
among European shoppers, with 53% perceiving this area to
be either ‘Excellent’ or ‘Very Good’ compared to 45% of those shopping on-land.
Retailers should look to tailor the shopping environment to the product range, with high-end Fashion or Jewellery stores driving perceptions of elegance and prestige through minimalistic store layouts, visually appealing promotional fixtures, such as mannequins, and a strong staff presence to assist wherever possible. This could be further supported via offering luxury services, such as closed store experiences at off-peak times or personal shopping experiences during normal store opening hours. On-land stores should look to tailor the store environment to the local area, with fixtures reflecting local traditions and heritage.
In addition, our research has also highlighted how stores, particularly on-board the cruise liner, can become overcrowded, especially at times of promotional activity, such as special discount periods. Store operators should ensure overcrowding does not negatively impact the store environment through operating a ‘maximum store capacity’ policy or by ensuring staff levels are sufficient to meet the increased store footfall.
ON-BOARD...
Italians have a significantly more positive perception of this area compared to other nationalities; younger, male and North European travellers also more positive.
Figure 15: Shopping Environment Perceptions: On-board
ON-LAND...
Italians are significantly more positive than British and German shoppers. Younger shoppers and those travelling in Northern Europe also more positive.
Figure 16: Shopping Environment Perceptions: On-land
Excellent Very Good Good Poor/Very/Extremely Poor
16%
37%
43% 4%
Excellent Very Good Good Poor/Very/Extremely Poor
12%
33%
46% 9%
© Counter Intelligence Retail Ltd www.counterintelligenceretail.com
55
