
Page 748 - outbind://23/
P. 748
Products and financial services provided by
AMERICAN UNITED LIFE INSURANCE COMPANY Ò | a ONEAMERICA ® company
Expense Investment
Investment Option Expense Ratio per 10 year or option
Foreign Stocks Investment Type Ratio % $1000 1 year 5 year inception inception
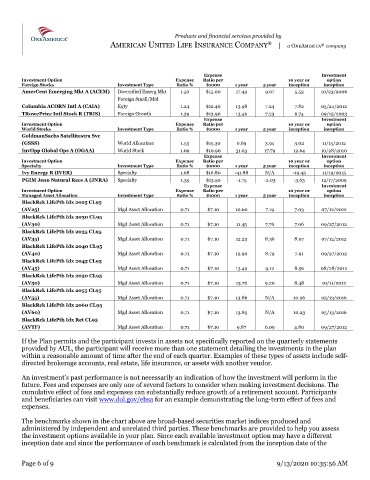
AmerCent Emerging Mkt A (ACEM) Diversified Emerg Mkt 1.50 $15.00 17.43 9.67 5.53 10/23/2006
Foreign Small/Mid
Columbia ACORN Intl A (CAIA) Eqty 1.24 $12.40 13.98 7.24 7.82 05/24/2012
TRowePrice Intl Stock R (TRIS) Foreign Growth 1.39 $13.90 13.46 7.23 6.74 09/15/2003
Expense Investment
Investment Option Expense Ratio per 10 year or option
World Stocks Investment Type Ratio % $1000 1 year 5 year inception inception
GoldmanSachs Satellitestra Svc
(GSSS) World Allocation 1.53 $15.30 0.69 3.94 3.02 11/15/2012
InvOpp Global Ops A (OGAA) World Stock 1.09 $10.90 31.63 17.79 12.64 10/28/2010
Expense Investment
Investment Option Expense Ratio per 10 year or option
Specialty Investment Type Ratio % $1000 1 year 5 year inception inception
Ivy Energy R (IVER) Specialty 1.68 $16.80 -41.88 N/A -19.45 11/19/2015
PGIM Jenn Natural Recs A (JNRA) Specialty 1.35 $13.50 -1.75 -2.03 -3.63 12/17/2009
Expense Investment
Investment Option Expense Ratio per 10 year or option
Managed Asset Allocation Investment Type Ratio % $1000 1 year 5 year inception inception
BlackRck LifePth Idx 2025 CL95
(AV25) Mgd Asset Allocation 0.71 $7.10 10.60 7.19 7.03 07/12/2012
BlackRck LifePth Idx 2030 CL95
(AV30) Mgd Asset Allocation 0.71 $7.10 11.45 7.76 7.06 09/27/2012
BlackRck LifePth Idx 2035 CL95
(AV35) Mgd Asset Allocation 0.71 $7.10 12.23 8.36 8.07 07/12/2012
BlackRck LifePth Idx 2040 CL95
(AV40) Mgd Asset Allocation 0.71 $7.10 12.90 8.79 7.91 09/27/2012
BlackRck LifePth Idx 2045 CL95
(AV45) Mgd Asset Allocation 0.71 $7.10 13.49 9.12 8.56 08/28/2012
BlackRck LifePth Idx 2050 CL95
(AV50) Mgd Asset Allocation 0.71 $7.10 13.76 9.20 8.48 10/11/2012
BlackRck LifePth Idx 2055 CL95
(AV55) Mgd Asset Allocation 0.71 $7.10 13.86 N/A 10.26 05/13/2016
BlackRck LifePth Idx 2060 CL95
(AV60) Mgd Asset Allocation 0.71 $7.10 13.85 N/A 10.23 05/13/2016
BlackRck LifePth Idx Ret CL95
(AVTF) Mgd Asset Allocation 0.71 $7.10 9.87 6.09 4.80 09/27/2012
If the Plan permits and the participant invests in assets not specifically reported on the quarterly statements
provided by AUL, the participant will receive more than one statement detailing the investments in the plan
within a reasonable amount of time after the end of each quarter. Examples of these types of assets include self-
directed brokerage accounts, real estate, life insurance, or assets with another vendor.
An investment’s past performance is not necessarily an indication of how the investment will perform in the
future. Fees and expenses are only one of several factors to consider when making investment decisions. The
cumulative effect of fees and expenses can substantially reduce growth of a retirement account. Participants
and beneficiaries can visit www.dol.gov/ebsa for an example demonstrating the long-term effect of fees and
expenses.
The benchmarks shown in the chart above are broad-based securities market indices produced and
administered by independent and unrelated third parties. These benchmarks are provided to help you assess
the investment options available in your plan. Since each available investment option may have a different
inception date and since the performance of each benchmark is calculated from the inception date of the
Page 6 of 9 9/13/2020 10:35:56 AM