
Page 1027 - AnnualEducationReport2018-19
P. 1027
04/10/2019 Reason for Accountabili Overall EL General School Identificatio ty Status Index Value Participation Participation Quality/Stu n Index Value Index Value dent Success Index Value N/A N/A 72.64 N/A 100.00 91.01 N/A N/A 79.91 73.59 99.97 85.59 N/A N/A 63.32 N/A 100.00 84.78 N/A N/A 48.21 N/A 100.00 85.40 N/A N/A 49.17 N/A 100.00 71.31 N/A N/A 54.05 N/A 100.00 54.96 N/A N/A N/A N/A N/A N/A N/A N/A 32.47 N/A 100.00 63.59 Page 517 of 613
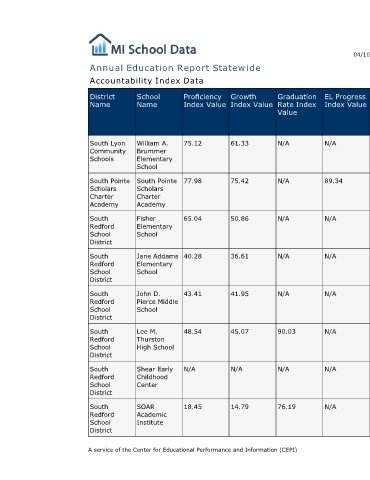
EL Progress Index Value N/A 89.34 N/A N/A N/A N/A N/A N/A
Graduation Rate Index Value N/A N/A N/A N/A N/A 90.03 N/A 76.19
Annual Education Report Statewide
Growth Index Value 61.33 75.42 50.86 36.61 41.95 45.07 N/A 14.79
Proficiency Index Value 75.12 77.98 65.04 40.28 43.41 48.54 N/A 18.45 A service of the Center for Educational Performance and Information (CEPI)
Accountability Index Data
School Name William A. Brummer Elementary School South Pointe Scholars Charter Academy Fisher Elementary School Jane Addams Elementary School John D. Pierce Middle School Lee M. Thurston High School Shear Early Childhood Center SOAR Academic Institute
District Name South Lyon Community Schools South Pointe Scholars Charter Academy South Redford School District South Redford School District South Redford School District South Redford School District South Redford School District South Redford School District