
Page 124 - AnnualEducationReport2018-19
P. 124
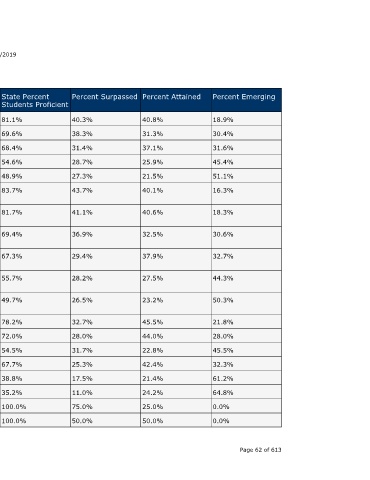
Percent Emerging  18.9%  30.4%  31.6%  45.4%  51.1%  16.3%  18.3%  30.6%  32.7%  44.3%  50.3%  21.8%  28.0%  45.5%  32.3%  61.2%  64.8%  0.0%  0.0%  Page 62 of 613


                                  Percent Attained  40.8%  31.3%  37.1%  25.9%  21.5%  40.1%  40.6%  32.5%  37.9%  27.5%  23.2%  45.5%  44.0%  22.8%  42.4%  21.4%  24.2%  25.0%  50.0%


                                  Percent Surpassed  40.3%  38.3%  31.4%  28.7%  27.3%  43.7%  41.1%  36.9%  29.4%  28.2%  26.5%  32.7%  28.0%  31.7%  25.3%  17.5%  11.0%  75.0%  50.0%


                                  State Percent Students Proficient                                                                     100.0%  100.0%


                    04/10/2019           81.1%  69.6%  68.4%  54.6%  48.9%  83.7%  81.7%  69.4%  67.3%  55.7%  49.7%  78.2%  72.0%  54.5%  67.7%  38.8%  35.2%


                                  School Year  2017-18  2016-17  2017-18  2016-17  2017-18  2016-17  2017-18  2016-17  2017-18  2016-17  2017-18  2016-17  2017-18  2016-17  2017-18  2016-17  2017-18  2016-17  2017-18


                                  Testing Group  Male  Male  Male  Male  Male  Economically  Disadvantaged  Economically  Disadvantaged  Economically  Disadvantaged  Economically  Disadvantaged  Economically  Disadvantaged  Economically  Disadvantaged  English Learners  English Learners  English Learners  English Learners  English Learners  English Learners  Migrant  Migrant


                        Annual Education Report Statewide

                             MI-Access Functional Independence


                                         4th Grade Content  4th Grade Content  4th Grade Content  4th Grade Content  4th Grade Content  4th Grade Content  4th Grade Content  4th Grade Content  4th Grade Content  4th Grade Content  4th Grade Content  4th Grade Content  4th Grade Content  4th Grade Content  4th Grade Content  4th Grade Content  4th Grade Content  4th Grade Content  4th Grade Content A service of the Center for Educational Performance and Information (CEPI)


                                  Grade


                                  Subject  ELA  Mathematics  Mathematics  Science  Science  ELA  ELA  Mathematics  Mathematics  Science  Science  ELA  ELA  Mathematics  Mathematics  Science  Science  ELA  ELA