
Page 14 - AnnualEducationReport2018-19
P. 14
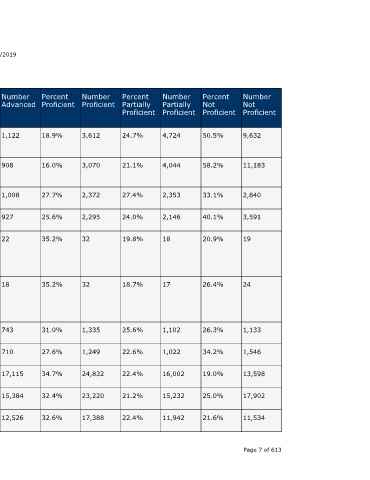
Number  Not  Proficient  9,632  11,183  2,840  3,591  19      24             1,133  1,546  13,598  17,902  11,534   Page 7 of 613


                                  Percent  Not  Proficient  50.5%  58.2%  33.1%  40.1%  20.9%   26.4%          26.3%  34.2%  19.0%  25.0%   21.6%


                                  Number  Partially  Proficient  4,724  4,044  2,353  2,146  18  17            1,102  1,022  16,002  15,232  11,942


                                  Percent  Partially  Proficient  24.7%  21.1%  27.4%  24.0%  19.8%  18.7%     25.6%  22.6%  22.4%  21.2%   22.4%


                                  Number  Proficient  3,612  3,070  2,372  2,295  32            32             1,335  1,249  24,832  23,220  17,388


                                  Percent  Proficient  18.9%  16.0%  27.7%  25.6%  35.2%        35.2%          31.0%  27.6%  34.7%  32.4%   32.6%


                    04/10/2019    Number  Advanced  1,122  908    1,008  927     22             18             743    710    17,115  15,384  12,526


                                  Percent  Advanced  5.9%  4.7%   11.8%  10.3%   24.2%          19.8%          17.2%  15.7%  23.9%  21.4%   23.5%


                                  State  Number  Students  Proficient  4,734  3,978  3,380  3,222  54  50      2,078  1,959  41,947  38,604  29,914


                                  State  Percent  Students  Proficient  24.8%  20.7%  39.4%  36.0%  59.3%  54.9%  48.2%  43.3%  58.6%  53.8%  56.0%
                        Annual Education Report Statewide


                                  School  Year  2016-17  2017-18  2016-17  2017-18  2016-17     2017-18        2016-17  2017-18  2016-17  2017-18  2016-17


                                  Testing  Group  Black or  African  American  Black or  African  American  Hispanic of  Any Race  Hispanic of  Any Race  Native  Hawaiian  or Other  Pacific  Islander  Native  Hawaiian  or Other  Pacific  Islander  Two or  More Races  Two or  More Races  White  White  Female A service of the Center for Educational Performance and Information (CEPI)


                             M-STEP Grades 3-11  Grade  Subject  5th Grade  ELA  Content  5th Grade  ELA  Content  5th Grade  ELA  Content  5th Grade  ELA  Content  5th Grade  ELA  Content  5th Grade  ELA  Content  5th Grade  ELA  Content  5th Grade  ELA  Content  5th Grade  ELA  Content  5th Grade  ELA  Content  5th Grade  ELA  Content