
Page 24 - AnnualEducationReport2018-19
P. 24
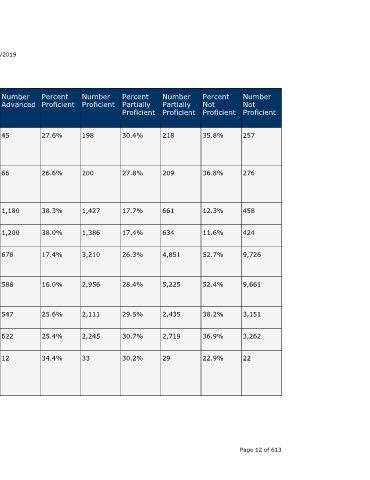
Number  Not  Proficient  257  276    458     424    9,726     9,661    3,151   3,262  22                            Page 12 of 613


                                  Percent  Not  Proficient  35.8%  36.8%  12.3%  11.6%  52.7%   52.4%    38.2%   36.9%  22.9%


                                  Number  Partially  Proficient  218  209  661  634   4,851     5,225    2,435   2,719  29


                                  Percent  Partially  Proficient  30.4%  27.8%  17.7%  17.4%  26.3%  28.4%  29.5%  30.7%  30.2%


                                  Number  Proficient  198  200         1,427   1,386  3,210     2,956    2,111   2,245  33


                                  Percent  Proficient  27.6%  26.6%    38.3%   38.0%  17.4%     16.0%    25.6%   25.4%  34.4%


                    04/10/2019    Number  Advanced  45     66          1,180   1,200  678       588      547     622    12


                                  Percent  Advanced  6.3%  8.8%        31.7%   32.9%  3.7%      3.2%     6.6%    7.0%   12.5%


                                  State  Number  Students  Proficient  243  266  2,607  2,586  3,888  3,544  2,658  2,867  45


                                  State  Percent  Students  Proficient  33.8%  35.4%  70.0%  71.0%  21.1%  19.2%  32.2%  32.4%  46.9%
                        Annual Education Report Statewide


                                  School  Year  2016-17    2017-18     2016-17  2017-18  2016-17  2017-18  2016-17  2017-18  2016-17


                                  Testing  Group  American  Indian or  Alaska  Native  American  Indian or  Alaska  Native  Asian  Asian  Black or  African  American  Black or  African  American  Hispanic of  Any Race  Hispanic of  Any Race  Native  Hawaiian  or Other  Pacific  Islander  A service of the Center for Educational Performance and Information (CEPI)


                             M-STEP Grades 3-11  Grade  Subject  7th Grade  ELA  Content  7th Grade  ELA  Content  7th Grade  ELA  Content  7th Grade  ELA  Content  7th Grade  ELA  Content  7th Grade  ELA  Content  7th Grade  ELA  Content  7th Grade  ELA  Content  7th Grade  ELA  Content