
Page 244 - AnnualEducationReport2018-19
P. 244
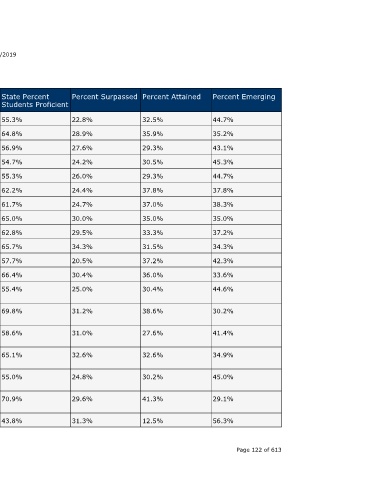
Percent Emerging  44.7%  35.2%  43.1%  45.3%  44.7%  37.8%  38.3%  35.0%  37.2%  34.3%  42.3%  33.6%  44.6%  30.2%  41.4%  34.9%  45.0%  29.1%  56.3%  Page 122 of 613


                                  Percent Attained  32.5%  35.9%  29.3%  30.5%  29.3%  37.8%  37.0%  35.0%  33.3%  31.5%  37.2%  36.0%  30.4%  38.6%  27.6%  32.6%  30.2%  41.3%  12.5%


                                  Percent Surpassed  22.8%  28.9%  27.6%  24.2%  26.0%  24.4%  24.7%  30.0%  29.5%  34.3%  20.5%  30.4%  25.0%  31.2%  31.0%  32.6%  24.8%  29.6%  31.3%


                                  State Percent Students Proficient


                    04/10/2019           55.3%  64.8%  56.9%  54.7%  55.3%  62.2%  61.7%  65.0%  62.8%  65.7%  57.7%  66.4%  55.4%  69.8%  58.6%  65.1%  55.0%  70.9%  43.8%


                                  School Year  2016-17  2017-18  2016-17  2017-18  2016-17  2017-18  2016-17  2017-18  2016-17  2017-18  2016-17  2017-18  2016-17  2017-18  2016-17  2017-18  2016-17  2017-18  2016-17


                                  Testing Group  Female  Female  Female  Female  Female  Female  Male  Male  Male  Male  Male  Male  Economically  Disadvantaged  Economically  Disadvantaged  Economically  Disadvantaged  Economically  Disadvantaged  Economically  Disadvantaged  Economically  Disadvantaged  English Learners


                        Annual Education Report Statewide


                             MI-Access Participation  Grade  Subject  7th Grade Content  ELA  7th Grade Content  ELA  7th Grade Content Mathematics  7th Grade Content Mathematics  7th Grade Content Science  7th Grade Content  Science  7th Grade Content  ELA  7th Grade Content  ELA  7th Grade Content Mathematics  7th Grade Content Mathematics  7th Grade Content  Science  7th Grade Content Science  7th Grade Content  ELA  7th Grade Content  ELA  7th Grade Content Mathematics  7th Grade Content Mathematics  7th Grade Content  Science  7th Grade Content  Science  7th Grade Content  ELA A service of the Center for Educational Per