
Page 69 - AnnualEducationReport2018-19
P. 69
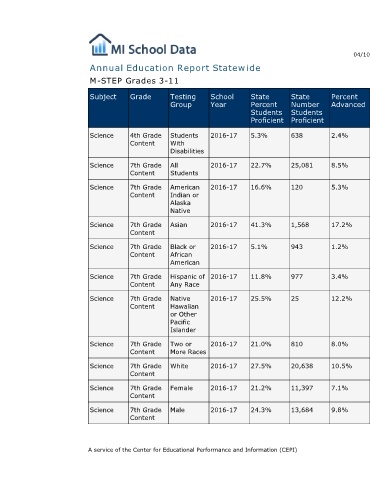
04/10/2019    Number  Percent Number  Percent Number  Percent Number  Not  Not Partially Partially Proficient Proficient Advanced  Proficient Proficient Proficient Proficient  9,549  78.9%  1,922  15.9%  353  2.9%  285  58,471  53.0%  26,702  24.2%  15,708  14.2%  9,373  453  62.7%  150  20.7%  82  11.3%  38  1,232  32.4%  999  26.3%  914  24.1%  654  15,160  82.3%  2,313  12.6%  728  4.0%  215  5,681  68.6%  1,620  19.6%  696  8.4%  281  50  51.0%  23  23.5%  13  13.3%  12  2,123  55.1%  917  23.8%  501  13.0%  309  33,772  45.0%  20,680  27.5%  12,774  17.0%  7,864  28,606  53.1%  13,826  25.7%  7,576
                                  Percent  Advanced  2.4%  8.5%  5.3%       17.2%  1.2%      3.4%   12.2%          8.0%    10.5%  7.1%   9.8%


                                  State  Number  Students  Proficient  638  25,081  120  1,568  943  977  25       810     20,638  11,397  13,684


                                  State  Percent  Students  Proficient  5.3%  22.7%  16.6%  41.3%  5.1%  11.8%  25.5%  21.0%  27.5%  21.2%  24.3%
                        Annual Education Report Statewide


                                  School  Year  2016-17  2016-17  2016-17   2016-17  2016-17  2016-17  2016-17     2016-17  2016-17  2016-17  2016-17


                                  Testing  Group  Students  With  Disabilities  All  Students  American  Indian or  Alaska  Native  Asian  Black or  African  American  Hispanic of  Any Race  Native  Hawaiian  or Other  Pacific  Islander  Two or  More Races  White  Female  Male  A service of the Center for Educational Performance and Information (CEPI)

                             M-STEP Grades 3-11  Grade  Subject  4th Grade  Science  Content  7th Grade  Science  Content  7th Grade  Science  Content  7th Grade  Science  Content  7th Grade  Science  Content  7th Grade  Science  Content  7th Grade  Science  Content  7th Grade  Science  Content  7th Grade  Science  Content  7th Grade  Science  Content  7th Grade  Science  Content