
Page 871 - AnnualEducationReport2018-19
P. 871
04/10/2019 Reason for Accountabili Overall EL General School Identificatio ty Status Index Value Participation Participation Quality/Stu n Index Value Index Value dent Success Index Value N/A N/A 40.29 N/A 100.00 77.05 N/A N/A N/A N/A N/A N/A N/A N/A 70.53 N/A 100.00 84.49 N/A N/A 58.73 N/A 99.97 79.33 N/A N/A N/A N/A N/A N/A N/A N/A 33.35 N/A 98.97 49.47 N/A N/A 35.25 N/A 100.00 66.16 Page 439 of 613
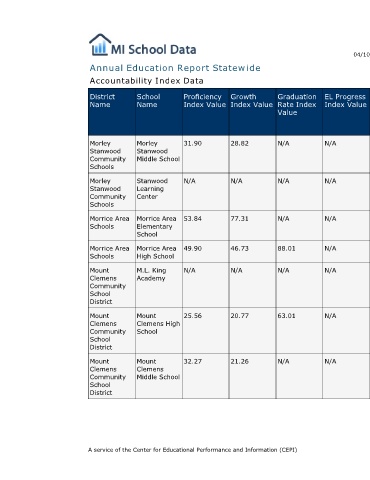
EL Progress Index Value N/A N/A N/A N/A N/A N/A N/A
Graduation Rate Index Value N/A N/A N/A 88.01 N/A 63.01 N/A
Annual Education Report Statewide
Growth Index Value 28.82 N/A 77.31 46.73 N/A 20.77 21.26
Proficiency Index Value 31.90 N/A 53.84 49.90 N/A 25.56 32.27 A service of the Center for Educational Performance and Information (CEPI)
Accountability Index Data
School Name Morley Stanwood Middle School Stanwood Learning Center Morrice Area Elementary School Morrice Area High School M.L. King Academy Mount Clemens High School Mount Clemens Middle School
District Name Morley Stanwood Community Schools Morley Stanwood Community Schools Morrice Area Schools Morrice Area Schools Mount Clemens Community School District Mount Clemens Community School District Mount Clemens Community School District