
Page 92 - AnnualEducationReport2018-19
P. 92
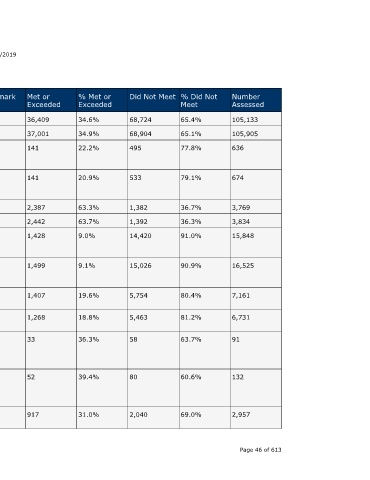
Number  Assessed  105,133  105,905  636  674  3,769  3,834  15,848  16,525  7,161  6,731  91  132        2,957      Page 46 of 613


                                  % Did Not  Meet  65.4%  65.1%  77.8%  79.1%  36.7%  36.3%  91.0%  90.9%  80.4%  81.2%  63.7%  60.6%      69.0%


                                  Did Not Meet  68,724  68,904  495  533  1,382  1,392  14,420  15,026  5,754  5,463  58      80           2,040


                                  % Met or  Exceeded  34.6%  34.9%  22.2%  20.9%  63.3%  63.7%  9.0%  9.1%  19.6%  18.8%  36.3%  39.4%     31.0%


                                  Met or  Exceeded  36,409  37,001  141  141  2,387  2,442  1,428  1,499  1,407  1,268  33    52           917


                    04/10/2019    Benchmark  N/A  N/A  N/A  N/A       N/A  N/A  N/A      N/A       N/A    N/A     N/A         N/A          N/A


                                  Mean SAT  Score  1000.1  1007.6  941.3  955.0  1163.2  1169.1  861.8  869.5  929.1  933.4  1000.8  1031.8  985.9


                                  Student  Group  All Students  All Students  American  Indian or  Alaska Native  American  Indian or  Alaska Native  Asian  Asian  Black or  African  American  Black or  African  American  Hispanic of  Any Race  Hispanic of  Any Race  Native  Hawaiian or  Other Pacific  Islander  Native  Hawaiian or  Other Pacific  Islander  Two or More  Races
                        Annual Education Report Statewide


                                  Subject  Total Score  Total Score  Total Score  Total Score  Total Score  Total Score  Total Score  Total Score  Total Score  Total Score  Total Score  Total Score  Total Score A service of the Center for Educational Performance and Information (CEPI)


                                  School Year  2017-18  2016-17  2017-18  2016-17  2016-17  2017-18  2017-18  2016-17  2017-18  2016-17  2017-18  2016-17  2017-18


                             SAT  Location  Name  Statewide  Statewide  Statewide  Statewide  Statewide  Statewide  Statewide  Statewide  Statewide  Statewide  Statewide  Statewide  Statewide