
Page 1044 - AnnualEducationReport2018-19
P. 1044
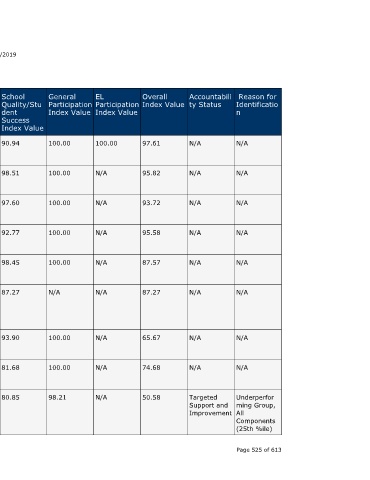
Reason for  Identificatio  n  N/A  N/A  N/A  N/A     N/A       N/A            N/A       N/A       Underperfor  ming Group,  All  Components  (25th %ile)  Page 525 of 613


                                  Accountabili  ty Status  N/A  N/A  N/A       N/A      N/A       N/A            N/A       N/A       Targeted  Support and  Improvement


                                  Overall  Index Value  97.61  95.82  93.72    95.58    87.57     87.27          65.67     74.68     50.58


                                    Participation  Index Value


                                  EL             100.00    N/A       N/A       N/A      N/A       N/A            N/A       N/A       N/A


                                  General  Participation  Index Value  100.00  100.00  100.00  100.00  100.00  N/A  100.00  100.00   98.21


                    04/10/2019    School  Quality/Stu  dent  Success  Index Value  90.94  98.51  97.60  92.77  98.45  87.27  93.90  81.68  80.85


                                  EL Progress  Index Value  N/A  N/A  N/A      N/A      N/A       N/A            N/A       N/A       N/A


                                  Graduation  Rate Index  Value  N/A  N/A  N/A  98.77   N/A       N/A            N/A       98.94     N/A


                        Annual Education Report Statewide
                                  Growth  Index Value  98.11  94.37  92.53     93.97    85.49     N/A            58.92     61.19     42.95


                                  Proficiency  Index Value  100.00  95.92  92.84  97.42  83.91    N/A            57.59     77.02     41.62            A service of the Center for Educational Performance and Information (CEPI)


                             Accountability Index Data


                                  School  Name   Brown School  Clarke School  Lincoln  School  St. Joseph  High School  Upton Middle  School  Carrie  Knause Early  Childhood  Learning  Center  Eugene M.  Nikkari  Elementary  St. Louis  High School  T.S.  Nurnberger  Middle School


                                  District  Name  St. Joseph  Public  Schools  St. Joseph  Public  Schools  St. Joseph  Public  Schools  St. Joseph  Public  Schools  St. Joseph  Public  Schools  St. Louis  Public  Schools  St. Louis  Public  Schools  St. Louis  Public  Schools  St. Louis  Public  Schools