Page 1196 - AnnualEducationReport2018-19
P. 1196

04/10/2019
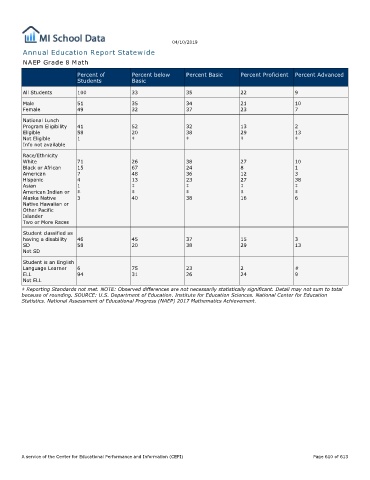
         Annual Education Report Statewide
         NAEP Grade 8 Math

                           Percent of        Percent below     Percent Basic     Percent Proficient  Percent Advanced
                           Students          Basic

         All Students      100               33                35                22                9
         Male              51                35                34                21                10
         Female            49                32                37                23                7
         National Lunch
         Program Eligibility  41             52                32                13                2
         Eligible          58                20                38                29                13
         Not Eligible      1                 ‡                 ‡                 ‡                 ‡
         Info not available

         Race/Ethnicity
         White             71                26                38                27                10
         Black or African  15                67                24                8                 1
         American          7                 48                36                12                3
         Hispanic          4                 13                23                27                38
         Asian             1                 ‡                 ‡                 ‡                 ‡
         American Indian or  ‡               ‡                 ‡                 ‡                 ‡
         Alaska Native     3                 40                38                16                6
         Native Hawaiian or
         Other Pacific
         Islander
         Two or More Races

         Student classified as
         having a disability  46             45                37                15                3
         SD                58                20                38                29                13
         Not SD

         Student is an English
         Language Learner  6                 75                23                2                 #
         ELL               94                31                26                24                9
         Not ELL
        ‡ Reporting Standards not met. NOTE: Observed differences are not necessarily statistically significant. Detail may not sum to total
        because of rounding. SOURCE: U.S. Department of Education. Institute for Education Sciences. National Center for Education
        Statistics. National Assessment of Educational Progress (NAEP) 2017 Mathematics Achievement.


        A service of the Center for Educational Performance and Information (CEPI)                       Page 610 of 613
   1191   1192   1193   1194   1195   1196   1197   1198   1199