
Page 329 - AnnualEducationReport2018-19
P. 329
04/10/2019 Reason for Accountabili Overall EL General School Identificatio ty Status Index Value Participation Participation Quality/Stu n Index Value Index Value dent Success Index Value N/A N/A 68.73 N/A N/A 68.73 N/A N/A 17.56 N/A 99.89 48.86 N/A N/A 67.65 100.00 N/A 65.34 N/A N/A 38.16 100.00 99.96 71.06 N/A N/A 54.67 100.00 100.00 77.91 Underperfomi Additional 31.67 100.00 99.84 60.00 ng Group, Targeted Overall (5th Support %ile) N/A N/A 10.78 N/A 97.53 20.00 N/A N/A 53.04 N/A 99.80 92.95 N/A N/A 39.78 N/A 100.00 84.64 Page 168 of 61
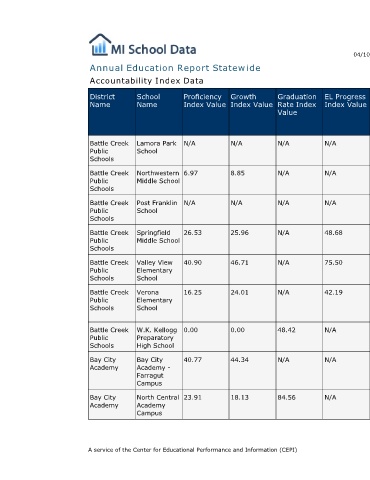
EL Progress Index Value N/A N/A N/A 48.68 75.50 42.19 N/A N/A N/A
Graduation Rate Index Value N/A N/A N/A N/A N/A N/A 48.42 N/A 84.56
Annual Education Report Statewide
Growth Index Value N/A 8.85 N/A 25.96 46.71 24.01 0.00 44.34 18.13
Proficiency Index Value N/A 6.97 N/A 26.53 40.90 16.25 0.00 40.77 23.91 A service of the Center for Educational Performance and Information (CEPI)
Accountability Index Data
School Name Lamora Park School Northwestern Middle School Post Franklin School Springfield Middle School Valley View Elementary School Verona Elementary School W.K. Kellogg Preparatory High School Bay City Academy - Farragut Campus North Central Academy Campus
District Name Battle Creek Public Schools Battle Creek Public Schools Battle Creek Public Schools Battle Creek Public Schools Battle Creek Public Schools Battle Creek Public Schools Battle Creek Public Schools Bay City Academy Bay City Academy