
Page 555 - AnnualEducationReport2018-19
P. 555
04/10/2019 Reason for Accountabili Overall EL General School Identificatio ty Status Index Value Participation Participation Quality/Stu n Index Value Index Value dent Success Index Value N/A N/A 96.08 100.00 100.00 93.07 N/A N/A 90.61 100.00 100.00 88.16 N/A N/A 78.72 100.00 100.00 86.99 N/A N/A 88.18 100.00 97.97 88.75 N/A N/A 82.76 100.00 100.00 90.80 N/A N/A 89.01 100.00 99.74 97.24 N/A N/A 97.73 100.00 99.34 89.65 N/A N/A 84.84 100.00 100.00 90.68 N/A N/A 71.88 100.00 100.00 90.42 N/A N/A N/A N/A N/A N/A Page 281 of 613
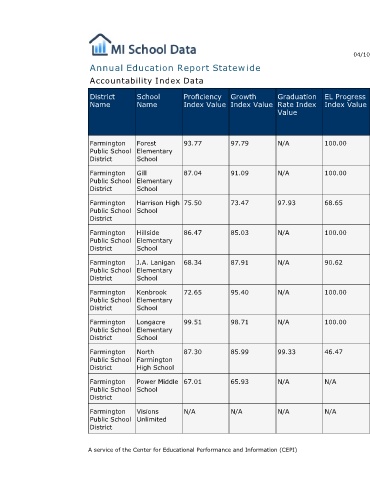
EL Progress Index Value 100.00 100.00 68.65 100.00 90.62 100.00 100.00 46.47 N/A N/A
Graduation Rate Index Value N/A N/A 97.93 N/A N/A N/A N/A 99.33 N/A N/A
Annual Education Report Statewide
Growth Index Value 97.79 91.09 73.47 85.03 87.91 95.40 98.71 85.99 65.93 N/A
Proficiency Index Value 93.77 87.04 75.50 86.47 68.34 72.65 99.51 87.30 67.01 N/A A service of the Center for Educational Performance and Information (CEPI)
Accountability Index Data
School Name Forest Elementary School Gill Elementary School Harrison High School Hillside Elementary School J.A. Lanigan Elementary School Kenbrook Elementary School Longacre Elementary School North Farmington High School Power Middle School Visions Unlimited
District Name Farmington Public School District Farmington Public School District Farmington Public School District Farmington Public School District Farmington Public School District Farmington Public School District Farmington Public School District Farmington Public School District Farmington Public School District Farmington Public School District