
Page 657 - AnnualEducationReport2018-19
P. 657
04/10/2019 Reason for Accountabili Overall EL General School Identificatio ty Status Index Value Participation Participation Quality/Stu n Index Value Index Value dent Success Index Value N/A N/A 54.89 100.00 100.00 74.16 N/A N/A 36.26 100.00 100.00 92.56 N/A N/A 61.47 100.00 100.00 92.03 N/A N/A 99.77 N/A 100.00 98.68 N/A N/A 85.41 N/A 100.00 97.53 N/A N/A 90.21 N/A 99.95 88.28 N/A N/A 97.53 N/A 100.00 97.56 N/A N/A 84.92 N/A 100.00 93.68 N/A N/A 98.40 N/A 100.00 98.24 Page 332 of 613
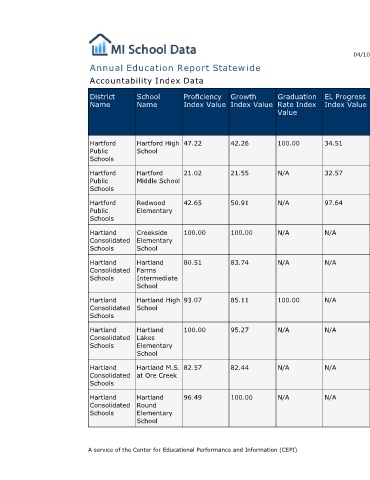
EL Progress Index Value 34.51 32.57 97.64 N/A N/A N/A N/A N/A N/A
Graduation Rate Index Value 100.00 N/A N/A N/A N/A 100.00 N/A N/A N/A
Annual Education Report Statewide
Growth Index Value 42.26 21.55 50.91 100.00 83.74 85.11 95.27 82.44 100.00
Proficiency Index Value 47.22 21.02 42.65 100.00 80.51 93.07 100.00 82.57 96.49 A service of the Center for Educational Performance and Information (CEPI)
Accountability Index Data
School Name Hartford High School Hartford Middle School Redwood Elementary Creekside Elementary School Hartland Farms Intermediate School Hartland High School Hartland Lakes Elementary School Hartland M.S. at Ore Creek Hartland Round Elementary School
District Name Hartford Public Schools Hartford Public Schools Hartford Public Schools Hartland Consolidated Schools Hartland Consolidated Schools Hartland Consolidated Schools Hartland Consolidated Schools Hartland Consolidated Schools Hartland Consolidated Schools