Page 771 - AnnualEducationReport2018-19
P. 771
04/10/2019     Reason for Accountabili  Overall  EL General  School  Identificatio ty Status Index Value Participation Participation Quality/Stu  n Index Value Index Value  dent  Success  Index Value  N/A  N/A  88.81  100.00  100.00  71.80  N/A  N/A  66.19  100.00  100.00  70.29  Underperfor Targeted  49.18  98.55  99.10  69.09  ming Group, Support and  All Improvement  Components  (25th %ile)  N/A  N/A  N/A  N/A  N/A  N/A  Underperfomi Additional  31.98  99.81  98.36  61.12  ng Group, Targeted  Overall (5th Support  %ile)  Underperfomi Additional  40.96  99.53  99.09  52.83  ng Group, Targeted  Overall (
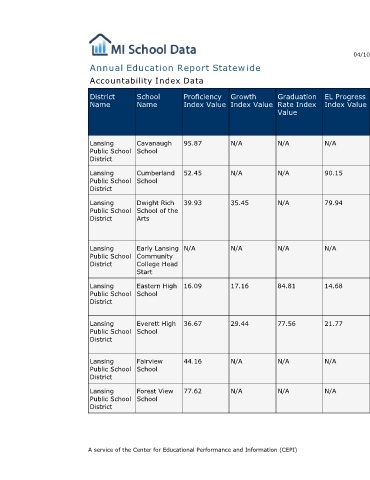
                                  EL Progress  Index Value  N/A  90.15  79.94       N/A         14.68        21.77       N/A       N/A


                                  Graduation  Rate Index  Value  N/A  N/A  N/A      N/A         84.81        77.56       N/A       N/A


                        Annual Education Report Statewide
                                  Growth  Index Value  N/A  N/A      35.45          N/A         17.16        29.44       N/A       N/A


                                  Proficiency  Index Value  95.87  52.45  39.93     N/A         16.09        36.67       44.16     77.62              A service of the Center for Educational Performance and Information (CEPI)

                             Accountability Index Data


                                  School  Name   Cavanaugh  School  Cumberland  School  Dwight Rich  School of the  Arts  Early Lansing  Community  College Head  Start  Eastern High  School  Everett High  School  Fairview  School  Forest View  School


                                  District  Name  Lansing  Public School  District  Lansing  Public School  District  Lansing  Public School  District  Lansing  Public School  District  Lansing  Public School  District  Lansing  Public School  District  Lansing  Public School  District  Lansing  Public School  District

