
Page 865 - AnnualEducationReport2018-19
P. 865
04/10/2019 Reason for Accountabili Overall EL General School Identificatio ty Status Index Value Participation Participation Quality/Stu n Index Value Index Value dent Success Index Value Underperfomi Additional 46.52 N/A 99.85 74.63 ng Group, Targeted Overall (5th Support %ile) Underperfomi Additional 21.54 N/A 78.43 24.20 ng Group, Targeted Overall (5th Support %ile) N/A N/A 57.33 N/A 100.00 76.79 N/A N/A N/A N/A N/A N/A N/A N/A 52.68 N/A 100.00 80.40 N/A N/A 63.97 N/A 100.00 77.83 N/A N/A 51.64 N/A 100.00 67.64 N/A N/A 78.66 N/A N/A 78.66
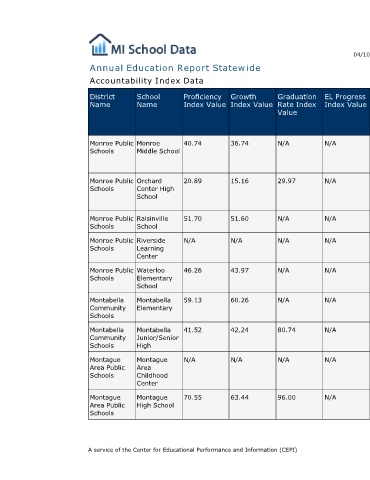
EL Progress Index Value N/A N/A N/A N/A N/A N/A N/A N/A N/A
Graduation Rate Index Value N/A 29.97 N/A N/A N/A N/A 80.74 N/A 96.00
Annual Education Report Statewide
Growth Index Value 36.74 15.16 51.60 N/A 43.97 60.26 42.24 N/A 63.44
Proficiency Index Value 40.74 20.89 51.70 N/A 46.26 59.13 41.52 N/A 70.55 A service of the Center for Educational Performance and Information (CEPI)
Accountability Index Data
School Name Monroe Middle School Orchard Center High School Raisinville School Riverside Learning Center Waterloo Elementary School Montabella Elementary Montabella Junior/Senior High Montague Area Childhood Center Montague High School
District Name Monroe Public Schools Monroe Public Schools Monroe Public Schools Monroe Public Schools Monroe Public Schools Montabella Community Schools Montabella Community Schools Montague Area Public Schools Montague Area Public Schools