
Page 921 - AnnualEducationReport2018-19
P. 921
04/10/2019 Reason for Accountabili Overall EL General School Identificatio ty Status Index Value Participation Participation Quality/Stu n Index Value Index Value dent Success Index Value N/A N/A 84.24 N/A 99.53 70.35 N/A N/A 57.96 N/A 99.54 88.33 N/A N/A 69.38 N/A 99.20 90.56 N/A N/A 83.66 N/A N/A 28.41 N/A N/A 68.52 N/A 100.00 77.86 N/A N/A 85.79 N/A 100.00 97.10 N/A N/A 76.13 N/A 99.77 92.96 N/A N/A 48.26 N/A 100.00 93.81 N/A N/A N/A N/A N/A N/A Page 464 of 613
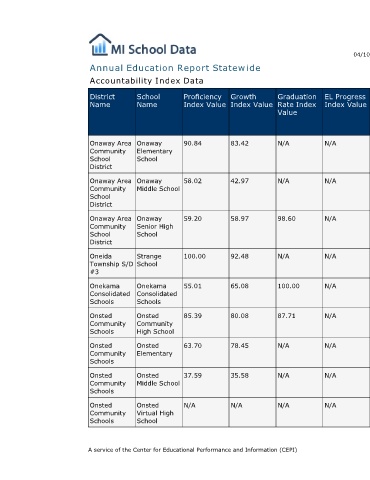
EL Progress Index Value N/A N/A N/A N/A N/A N/A N/A N/A N/A
Graduation Rate Index Value N/A N/A 98.60 N/A 100.00 87.71 N/A N/A N/A
Annual Education Report Statewide
Growth Index Value 83.42 42.97 58.97 92.48 65.08 80.08 78.45 35.58 N/A
Proficiency Index Value 90.84 58.02 59.20 100.00 55.01 85.39 63.70 37.59 N/A A service of the Center for Educational Performance and Information (CEPI)
Accountability Index Data
School Name Onaway Elementary School Onaway Middle School Onaway Senior High School Strange School Onekama Consolidated Schools Onsted Community High School Onsted Elementary Onsted Middle School Onsted Virtual High School
District Name Onaway Area Community School District Onaway Area Community School District Onaway Area Community School District Oneida Township S/D #3 Onekama Consolidated Schools Onsted Community Schools Onsted Community Schools Onsted Community Schools Onsted Community Schools