
Page 941 - AnnualEducationReport2018-19
P. 941
04/10/2019 Reason for Accountabili Overall EL General School Identificatio ty Status Index Value Participation Participation Quality/Stu n Index Value Index Value dent Success Index Value N/A N/A 86.31 N/A 100.00 86.10 N/A N/A 70.36 N/A 100.00 91.87 N/A N/A 63.68 N/A 100.00 84.30 Underperfor Targeted 70.48 N/A 96.04 80.35 ming Group, Support and All Improvement Components (25th %ile) N/A N/A 63.66 N/A 100.00 87.22 N/A N/A N/A N/A N/A N/A N/A N/A 88.17 N/A 100.00 85.91 N/A N/A 78.55 N/A 100.00 78.88 N/A N/A 52.59 N/A 100.00 82.08 Page 47
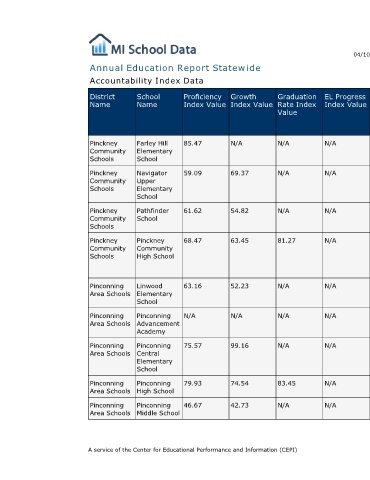
EL Progress Index Value N/A N/A N/A N/A N/A N/A N/A N/A N/A
Graduation Rate Index Value N/A N/A N/A 81.27 N/A N/A N/A 83.45 N/A
Annual Education Report Statewide
Growth Index Value N/A 69.37 54.82 63.45 52.23 N/A 99.16 74.54 42.73
Proficiency Index Value 85.47 59.09 61.62 68.47 63.16 N/A 75.57 79.93 46.67 A service of the Center for Educational Performance and Information (CEPI)
Accountability Index Data
School Name Farley Hill Elementary School Navigator Upper Elementary School Pathfinder School Pinckney Community High School Linwood Elementary School Pinconning Advancement Academy Pinconning Central Elementary School Pinconning High School Pinconning Middle School
District Name Pinckney Community Schools Pinckney Community Schools Pinckney Community Schools Pinckney Community Schools Pinconning Area Schools Pinconning Area Schools Pinconning Area Schools Pinconning Area Schools Pinconning Area Schools