
Page 949 - AnnualEducationReport2018-19
P. 949
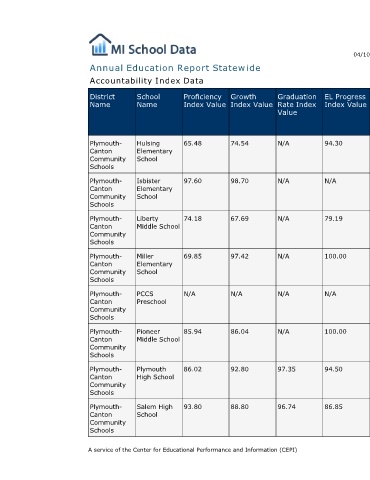
04/10/2019     Reason for Accountabili  Overall  EL General  School  Identificatio ty Status Index Value Participation Participation Quality/Stu  n Index Value Index Value  dent  Success  Index Value  N/A  N/A  76.25  96.31  100.00  84.96  N/A  N/A  97.61  95.98  100.00  94.74  N/A  N/A  76.22  94.26  99.67  94.43  N/A  N/A  88.15  99.07 100.00  92.52  N/A  N/A  N/A  N/A  N/A  N/A  N/A  N/A  89.31  96.11  99.99  94.52  N/A  N/A  91.28  97.75  99.54  90.17  N/A  N/A  91.98  99.95  100.00  94.51  Page 478 of 613
                                  EL Progress  Index Value  94.30  N/A    79.19       100.00       N/A         100.00       94.50       86.85


                                  Graduation  Rate Index  Value  N/A  N/A  N/A        N/A          N/A         N/A          97.35       96.74


                        Annual Education Report Statewide
                                  Growth  Index Value  74.54  98.70       67.69       97.42        N/A         86.04        92.80       88.80


                                  Proficiency  Index Value  65.48  97.60  74.18       69.85        N/A         85.94        86.02       93.80         A service of the Center for Educational Performance and Information (CEPI)

                             Accountability Index Data


                                  School  Name   Hulsing  Elementary  School  Isbister  Elementary  School  Liberty  Middle School  Miller  Elementary  School  PCCS  Preschool  Pioneer  Middle School  Plymouth  High School  Salem High  School


                                  District  Name  Plymouth-  Canton  Community  Schools  Plymouth-  Canton  Community  Schools  Plymouth-  Canton  Community  Schools  Plymouth-  Canton  Community  Schools  Plymouth-  Canton  Community  Schools  Plymouth-  Canton  Community  Schools  Plymouth-  Canton  Community  Schools  Plymouth-  Canton  Community  Schools