
Page 997 - AnnualEducationReport2018-19
P. 997
04/10/2019 Reason for Accountabili Overall EL General School Identificatio ty Status Index Value Participation Participation Quality/Stu n Index Value Index Value dent Success Index Value N/A N/A 37.74 N/A 100.00 74.09 N/A N/A 72.24 N/A 100.00 83.35 N/A N/A 85.22 N/A 100.00 88.84 N/A N/A 70.07 N/A 100.00 84.45 N/A N/A 18.18 N/A N/A 100.00 N/A N/A 59.15 N/A 100.00 65.01 N/A N/A 44.42 N/A 100.00 78.36 N/A N/A 49.24 N/A 100.00 67.86 N/A N/A 37.63 N/A 100.00 63.43 Page 502 of 613
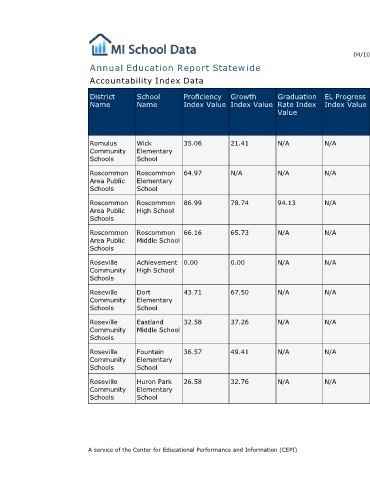
EL Progress Index Value N/A N/A N/A N/A N/A N/A N/A N/A N/A
Graduation Rate Index Value N/A N/A 94.13 N/A N/A N/A N/A N/A N/A
Annual Education Report Statewide
Growth Index Value 21.41 N/A 78.74 65.73 0.00 67.50 37.26 49.41 32.76
Proficiency Index Value 35.06 64.97 86.99 66.16 0.00 43.71 32.58 36.57 26.58 A service of the Center for Educational Performance and Information (CEPI)
Accountability Index Data
School Name Wick Elementary School Roscommon Elementary School Roscommon High School Roscommon Middle School Achievement High School Dort Elementary School Eastland Middle School Fountain Elementary School Huron Park Elementary School
District Name Romulus Community Schools Roscommon Area Public Schools Roscommon Area Public Schools Roscommon Area Public Schools Roseville Community Schools Roseville Community Schools Roseville Community Schools Roseville Community Schools Roseville Community Schools