
Page 16 - The MarchLife Story
P. 16
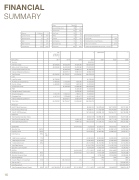
FINANCIAL
SUMMARY
16
Sources Limited Partner General Partner Debt
EB5 Investment Total Sources
$ Millions 90 10 135 110 345
% 26% 3% 39% 32% 100%
Soft Costs FF&E
Interest Contingency Developer Fees Total Uses
< De- velopment & Start U>p
2017 2018
32 9% 16 5% 55 16% 16 5% 14 4%
345 100%
2019
124,503,691
- 1,620,000 1,620,000 64,800,000 16,200,000 10,000,000 7,850,541 2,831,477 19,581,674 124,503,692
- - -
- 14,044,105 14,044,105
(14,044,105) - -
- - -
(14,044,105) (14,044,105) -
-14% (27,131,000)
Pro Forma Returns Summary
Project IRR = 29% Stabilized Cash-on Cash Returns = 18% Return on Investment = 257% Underwritten Build/Stabilize/Exit Period: 5-7 Years
< Operations >
Uses Capital
Land & Infrastructure 39 11% Construction 172 50%
2020 2021 2022 2023 Subtotals - - - 100,000,000 - - - 110,000,000 - - - 87,305,043 - - - 48,954,186 - - - 346,259,229 - - - Uses: ----
Description
Sources:
Partners’ Equity
EB5 Limited Partner Equity Construction/Permanent Loan Interest & Operating Reserve Total Sources
25,000,000 30,000,000 40,000,000 45,000,000 - 52,383,026 - 29,372,511 65,000,000 156,755,537
45,000,000 25,000,000 34,922,017 19,581,674
Land Purchase
Architecture & Engineering Permits & Fees
Construction Costs
FF&E
Parkng Structure Construction Other/Contingency
Developer Fee
Interest & Operating Reserve Total Uses
Revenues:
Net IP Patient Revenues
Net OP Patient Revenues Total IP & OP Revenues Expenses:
Total Variable Operation Costs Total Fixed Operating Costs Total Operating Expenses
EBITDARM
Operator Fee 3.50% Property Taxes 1.20%
Debt Service: 29% Eq-
uity
45,738,000 6,480,000 6,480,000
- - -
2,054,785 4,247,215 - 65,000,000
- 8,100,000 8,100,000 97,200,000 - - 6,904,334 7,078,692 29,372,511 156,755,537
45,738,000 16,200,000 16,200,000
162,000,000 16,200,000 10,000,000 16,809,660 14,157,383 48,954,186
346,259,229
90,858,194
76,686,141 167,544,335
84,652,139
79,861,567 164,513,706
3,030,629 (5,757,980) (3,373,261)
(3,000,000) (2,500,000) (6,110,756)
(11,610,756) 10,000,000 (7,711,367) (7,711,367)
- -5% -8%
(7,711,367)
- - - - - - - - - -
136,975,660 111,420,469 248,396,130
126,998,487 84,577,826 211,576,313
36,819,817 (7,405,171) (3,440,726)
(3,000,000) (2,500,000) (6,110,756)
(11,610,756) 10,000,000 24,363,164 14,617,898
9,745,266 10% 15%
14,617,898
- - - - - - - - - -
158,719,202 146,546,989 305,266,191
148,090,653 88,171,116 236,261,768
69,004,423 (8,269,162) (3,509,540)
(3,000,000) (2,500,000) (6,110,756)
(11,610,756) 10,000,000 55,614,965 33,368,979 22,245,986
18% 33%
33,368,979
- - - - - - - - - -
163,701,004 182,087,094 345,788,098
154,977,286 94,324,595 249,301,880
96,486,218 (8,725,566) (3,579,731)
(3,000,000) (2,500,000) (6,110,756)
(11,610,756) 10,000,000 82,570,165 49,542,099 33,028,066
24%
50% 535,590,260 (246,259,229) 338,873,130
EB5 Direct Investment 17% EB5 Regional Center 14% Construction Loan 39%
Total Debt Service
Operator Lease Payment
EBITDA
M3 Revenue Share 60% Operator Revenue Share 40% Operating Margin
Investor Return on Investment 3.65 X Sale at Year 5
Debt Repayment
Total Proceeds (Partners’ Equity) 29% IRR
(45,738,000)
365,104,535 (27,131,000)
