
Page 55 - 2020 Statistical Abstract
P. 55
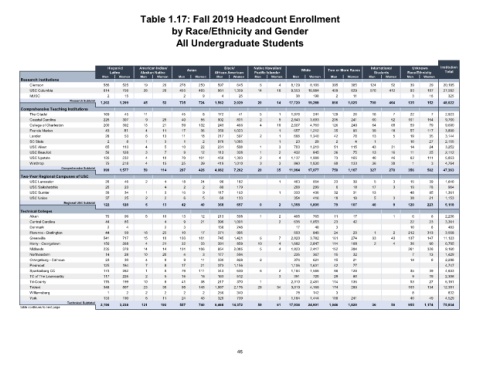
Table 1.17: Fall 2019 Headcount Enrollment
                                                          by Race/Ethnicity and Gender

                                                           All Undergraduate Students


                                     Hispanic/    American Indian/   Asian   Black/   Native Hawaiian/   White   Two or More Races  International    Unknown  Institution
                                     Latino    Alaskan Native           African American  Pacific Islander                  Students    Race/Ethnicity  Total
                                   Men  Women  Men   Women  Men  Women  Men   Women  Men   Women  Men  Women  Men   Women  Men  Women  Men   Women
        Research Institutions
           Clemson                 586   525    19     26   278    250   597   645     6     4   8,129  8,106  395   385   124    52    39     29  20,195
           USC Columbia            614   759    26     26   455    465   961  1,359   14    10   9,553  10,984  459  629   576   412    93    107  27,502
           MUSC                     2     15                  2     9     4     25                 38   198     2     11                 3     16    325
                        Research Subtotal
                                  1,202  1,299  45     52   735    724  1,562  2,029  20    14  17,720  19,288  856  1,025  700  464    135   152  48,022
        Comprehensive Teaching Institutions
           The Citadel             169    45    11           45     8    172    41     5     1   1,976  241    129    26    18     7    22     7    2,923
           Coastal Carolina        226   307     9     29    40    56    902   831     2     9   2,843  3,693  205   241    60    52    101   154   9,760
           College of Charleston   200   392    13     21    59    132   243   466     4    10   2,667  4,760  126   240    64    65    59     79   9,600
           Francis Marion           43    81     4     11    17    36    359  1,023          1    657  1,212   35     90    39    18    57    117   3,800
           Lander                   28    53     6     13    11    18    217   597     2     1    666  1,340   42     78    13     5    19     35   3,144
           SC State                 2      8     1     3      1     2    976  1,065          1     23    29     2     4     1           10     27   2,155
           USC Aiken                65   113     4     5     10    22    231   598     1     3    703  1,219   51    115    43    31    14     24   3,252
           USC Beaufort             56   128     3     7      9    12    113   328     1     2    432   845    36     75    13    16    11     25   2,112
           USC Upstate             135   232     4     10    70    101   450  1,303    2     4   1,137  1,908  73    165    40    46    62    111   5,853
           Winthrop                 75   218     4     15    25    39    419  1,010    3     3    860  1,830   60    133    36    30     1     3    4,764
                     Comprehensive Subtotal
                                   999  1,577   59    114   287    426  4,082  7,262  20    35  11,964  17,077  759  1,167  327  270    356   582  47,363
        Two-Year Regional Campuses of USC
           USC Lancaster            26    46     2     4     18    24     96   182           1    463   654    23     39     5     3    15     39   1,640
           USC Salkehatchie         20    23           4      2     2     86   179                208   299     6     18    17     3    19     78    964
           USC Sumter               39    34     1     3     16     9    117   163           1    333   436    32     31    13          48     85   1,361
           USC Union                37    25     2     2      6     5     69   133                354   416    18     19    5      3    38     21   1,153
                      Regional USC Subtotal
                                   122   128     5     13    42    40    368   657     0     2   1,358  1,805  79    107    40     9    120   223   5,118
        Technical Colleges
           Aiken                    70    99     5     10    13    12    213   508     1     2    495   765    11     17           1     6     8    2,236
           Central Carolina         44    85           4      9    21    396  1,001          2    636  1,053   23     42                22     23   3,361
           Denmark                  2      4           2      3          138   248                 17    48     3                       10     8     483
           Florence - Darlington    44    59    16     23    10    17    371   995                593   849    24     29     1     2    212   313   3,558
           Greenville              541   717    15     10   103    161   745  1,421    6     7   2,820  3,782  161   274    33    43    137   147  11,123
           Horry - Georgetown      150   268     4     21    32    33    391   859    10     4   1,682  2,847  114   188     2     4    36     60   6,705
           Midlands                235   379    14     14   101    106   954  2,085    5     4   1,823  2,417  152   284                261   326   9,160
           Northeastern             14    28    10     20     4     3    177   504                235   367    15     32                 7     13   1,429
           Orangeburg - Calhoun     23    30     4     8      9    11    330   828     2          374   621    15     21                14     8    2,298
           Piedmont                125   184     7     8     17    21    373  1,156              1,106  1,631  42     77                            4,747
           Spartanburg CC          173   262     1     8     79    111   343   630     6     2   1,184  1,566  66    128                35     39   4,633
           TC of The Lowcountry    117   225     2     5     15    18    163   512           3    391   720    29     80                 9     19   2,308
           Tri-County              176   199    10     8     41    38    217   370     1         2,310  2,481  114   136                53     27   6,181
           Trident                 348   507    23     39    95    143  1,087  2,176  28    34   3,010  4,168  174   280                105   134  12,351
           Williamsburg             1      2     2     2      2     2    250   340                 78   142     3                        8           832
           York                    133   190     8     11    24    43    320   739           3   1,184  1,444  100   241                40     49   4,529
                       Technical Subtotal  2,196  3,238  121  193  557  740  6,468  14,372  59  61  17,938  24,901  1,046  1,829  36  50  955  1,174  75,934
        table continues to next page


                                                                               46