
Page 15 - 86064_NSAA_W19_web
P. 15
group and the industry must ensure that it keeps them decisions. Another reason may be one’s significant other had
skiing because they are the future senior skiers. Programs a strong dislike of winter. Rather than take individual vaca-
developed for today’s senior skiers can be leveraged for tions, the couple started going places other than a ski area.
tomorrow’s senior skiers. Probably the number one reason is cost. Skiing can
NSAA’s data shows that the average Pre-Boomer skied be expensive. Depending on where you go, for a family of
9.78 days and the Baby-Boomer 6.86. Research done by four a ski trip can cost anywhere from $800 to more than
SeniorsSkiing.com (a virtual community for snow enthusiasts $1,000 per day for lifts, ski rentals, condo or hotel room,
over the age of 50) strongly suggests the senior skier is transportation, meals, etc., and may put a ski vacation out
a potential vehicle that can be leveraged to increase the total of reach for some families.
number of skiers. The online publication with thousands Vacations are often family decisions and as children get
of skiers over the age of 55 surveyed its subscribers and older, they get a voice if not a vote. Some may want to go
learned their average reader skis 15 days a year and visits to the beach; others choose skiing. As a result, the annual
three ski areas each season. One-third skied 23 days a ski vacation loses.
year! Fifty-six percent stated they spent between $1,000 The challenge for the ski industry as a whole is to find
and $5,000 on skiing last season, and 10 percent spent ways to get seniors and the lapsed skiers back. What programs
more than $5,000. does your area offer? What are you willing to implement?
This not only confirms NSAA’s data, it makes it hard You may want to consider some (or all) of the following:
to ignore. Imagine how many more skiers there would be • Offering social events
if the industry ramped up its collective effort to target this • Creating a senior club
skier segment and leveraged it to attract new skiers and • Reaching out to current and former season passholders
bring back those who stepped away. with a “Bring-A-Friend Back to Skiing” offer
• Working with active/over-55 communities
The Lapsed or Lost Skier
Let’s start with what NSAA calls the “lapsed skier” who is Seniors as ‘Bringers’ of New Skiers
“lost” to the sport because by definition, this person skied When most of the current senior skiers started skiing, they
at an earlier age and dropped out. Why? were expected to live into their late 60s or maybe into their
There are those whose choice of careers limited their early 70s. Now, actuaries and financial analysts say senior
ability to ski. It could be as simple as geography, with the skiers need to plan to live well into their 80s!
nearest ski area a day’s flight away. Or, it could be more com- The trend of living longer is reflected by the ever-
plex. Work and social priorities may have dictated work/life increasing age needed to qualify for senior discounts at
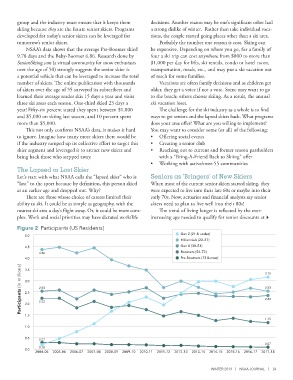
Figure 2 Participants (US Residents)
Gen Z (21 & under)
5.0
Millennials (22–37)
4.5 Gen X (38–53)
Boomers (54–72)
4.36
4.0 Pre-Boomers (73 & over) 3.15
Participants (in millions) 3.0 2.53 2.53
3.5
2.5
2.34
2.22
2.0
1.5
1.15
1.0
0.5
0.27
0.07
0.18
0.0
2004–05 2005–06 2006–07 2007–08 2008–09 2009–10 2010–11 2011–12 2012–13 2013–14 2014–15 2015–16 2016–17 2017–18
WINTER 2019 | NSAA JOURNAL | 13