
Page 193 - statbility for masters and mates
P. 193
Ans. Increase 1:52 m
Example 2
AX 1:85m AY 6:37m New draft 8:22m Olddraft 6:70m
1:52 m
Increase in draft due to list 181
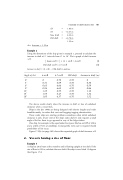
Using the dimensions of the ship given in example 1, proceed to calculate the increase in draft at 3 intervals from 0 to 18 . Plot a graph of draft increase
/ y.
12 beamsiny 12 12 siny 6siny Old draft cos y 6:7 cos y
I II
Increase in draft (m)
Increase in draft (I) (II) Old draft in metres.
Angle of list
0 3 6 9
12 15 18
6 sin y 6.7 cos y Old draft
06.706.700 0.31 6.69 6.70 0.30 0.63 6.66 6.70 0.59 0.94 6.62 6.70 0.86 1.25 6.55 6.70 1.10 1.55 6.47 6.70 1.32 1.85 6.37 6.70 1.52
The above results clearly show the increase in draft or loss of underkeel clearance when a vessel lists.
Ships in the late 1990s are being designed with shorter lengths and wider breadths mainly to reduce ®rst cost and hogging/sagging characteristics.
These wider ships are creating problems sometimes when initial underkeel clearance is only 10 per cent of the ship's static draft. It only requires a small angle of list for them to go aground in way of the bilge strakes.
One ship, for example, is the supertanker Esso Japan. She has an LBP of 350 m and a width of 70 m at amidships. Consequently extra care is required should possibilities of list occur.
Figure 17.2(b) (on page 182) shows the requested graph of draft increase / y. 2. Vessels having a rise of ¯oor
Example 3
A ship has 20 m beam at the waterline and is ¯oating upright at 6 m draft. If the rise of ¯oor is 0.25 m, calculate the new draft if the ship is now listed 15 degrees (See Figure 17.3)
