
Page 357 - statbility for masters and mates
P. 357
Bending of ships 345
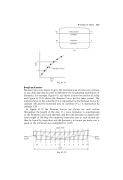
Bonjean Curves
Fig. 41.11
Bonjean Curves are drawn to give the immersed area of transverse sections to any draft and may be used to determine the longitudinal distribution of buoyancy. For example, Figure 41.11(a) shows a transverse section of a ship and Figure 41.11(b) shows the Bonjean Curve for the same section. The immersed area to the waterline WL is represented on the Bonjean Curve by ordinate AB, and the immersed area to waterline W1L1 is represented by ordinate CD.
In Figure 41.12 the Bonjean Curves are shown for each section throughout the length of the ship. If a wave formation is superimposed on the Bonjean Curves and adjusted until the total buoyancy is equal to the total weight of the ship, the immersed transverse area at each section can then be found by inspection and the buoyancy in tonnes per metre run is equal to the immersed area multiplied by 1.025.
Fig. 41.12
