
Page 359 - statbility for masters and mates
P. 359
Strength curves for ships 347
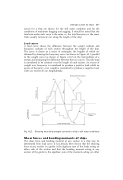
curves for a ship are shown for the still water condition and for the conditions of maximum hogging and sagging. It should be noted that the total area under each curve is the same, i.e. the total buoyancy is the same. Units usually tonnes/m run along the length of the ship.
Load curves
A load curve shows the difference between the weight ordinate and buoyancy ordinate of each section throughout the length of the ship. The curve is drawn as a series of rectangles, the heights of which are obtained by drawing the buoyancy curve (as shown in Figure 42.1) parallel to the weight curve (as shown in Figure 41.10) at the mid-ordinate of a section and measuring the difference between the two curves. Thus the load is considered to be constant over the length of each section. An excess of weight over buoyancy is considered to produce a positive load whilst an excess of buoyancy over weight is considered to produce a negative load. Units are tonnes/m run longitudinally.
Fig. 42.2. Showing three ship strength curves for a ship in still water conditions
Shear forces and bending moments of ships
The shear force and bending moment at any section in a ship may be determined from load curve. It has already been shown that the shearing force at any section in a girder is the algebraic sum of the loads acting on either side of the section and that the bending moment acting at any section of the girder is the algebraic sum of the moments acting on either
