
Page 360 - statbility for masters and mates
P. 360
348 Ship Stability for Masters and Mates
side of the section. It has also been shown that the shearing force at any section is equal to the area under the load curve from one end to the section concerned and that the bending moment at that section is equal to the area under the shearing force curve measured from the same end to that section.
Thus, for the mathematically minded, the shear force curve is the ®rst- order integral curve of the load curve and the bending moment curve is the ®rst-order integral curve of the shearing force curve. Therefore, the bending moment curve is the second-order integral curve of the load curve.
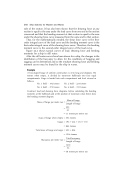
Figure 42.2 shows typical curves of load, shearing force and bending moments for a ship in still water.
After the still water curves have been drawn for a ship, the changes in the distribution of the buoyancy to allow for the conditions of hogging and sagging can be determined and so the resultant shearing force and bending moment curves may be found for the ship in waves.
Example
A box-shaped barge of uniform construction is 32 m long and displaces 352 tonnes when empty, is divided by transverse bulkheads into four equal compartments. Cargo is loaded into each compartment and level stowed as follows:
No. 1 hold x 192 tonnes No. 2 hold x 224 tonnes No. 3 hold x 272 tonnes No. 4 hold x 176 tonnes
Construct load and shearing force diagrams, before calculating the bending moments at the bulkheads and at the position of maximum value; hence draw the bending moment diagram.
Mass of barge per metre run Mass of barge Length of barge
352 32
11 tonnes per metre run
352 tonnes
mass of barge when empty Cargo
Total mass of barge and cargo
1216 tonnes
Buoyancy per metre run Total buoyancy Length of barge
1216 32
38 tonnes per metre run
192 224 272 176 864 tonnes
352 864
